

Related Products or Features: Business Intelligence (BI) Reports, Quality Management (CXone)
Required permissions: Report Viewer, Evaluations By Section And Question
Required Employee Settings: Can View BI Reports
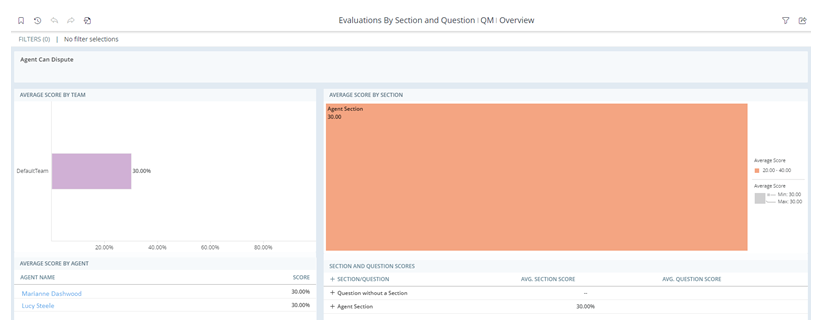
The Evaluations by Section and Question report displays data for agent evaluations, broken down by the sections and questions in a single evaluation form. You can use this information to identify evaluation trends in your organization.
This report is an advanced Business Intelligence (BI) report. BI reports allow you to perform actions such as drilling down to more details or grouping and exporting data.
The data for this report refreshes every hour. Date and time are displayed in UTC (GMT time zone).
To access and run this report:
-
Select the report you would like to run from the list.
-
Complete the report prompt. The available steps and options will vary for each report.
-
Click Run.
Note that you cannot use Re-Prompt  to make changes to the parameters of this report. There is no report prompt because it includes data for all skills by default. You can filter the report data to change what displays.
For most reports, you can filter the report data using a variety of parameters. You cannot use filters to change certain parameters you selected on the report prompt. However, you can use Re-Prompt to change the parameters of the report.
-
To change report parameters click Re-Prompt
. -
Edit the parameters you want to change. For example, if you want to change the time period you selected before, set Time Period to the new desired range.
-
When you are finished changing the report parameters, click Run.
These filters appear when you first run the report. They also appear when you click Re-Prompt in the top left of the report.
-
Time Period:
-
Evaluation Start Time Period: When evaluations started.
-
Evaluation Submitted Time Period: When evaluations were submitted.
-
Recorded Interaction Time Period: When interactions occurred.
After you click Run at the bottom of the Prompt, you choose a value for the time period, such as Today, Yesterday, and Last 7 Days. For example, if you select Evaluation Start Time Period, then specify a value of Yesterday, the report will display data for the evaluations that started yesterday.
-
-
Hierarchy: The hierarchy of users. Using this filter may increase the amount of time it takes to run the report.
-
Group: The group of users. Using this filter may increase the amount of time it takes to run the report.
-
Team: The team of users.
-
Skill: The skill
 Used to automate delivery of interactions based on agent skills, abilities, and knowledge. of the evaluated interaction.
 -
Form: The Quality Management (CXone) form. If the form name has a # at the end, it is deactivated. If it has an X, it was deleted.
-
Form Version: The version of the QM form.
These filters appear when you click Filter  in the top right:
-
Day: The time range for the data in the report.
-
Group: The group of users. Using this filter may increase the amount of time it takes to run the report.
-
Team: The team of users.
-
Agent: The evaluated agent.
-
Skill: The skill
Used to automate delivery of interactions based on agent skills, abilities, and knowledge. of the evaluated interaction. -
Form: The Quality Management (CXone) form.
-
Form Version: The version of the QM form.
Average Score by Team Widget
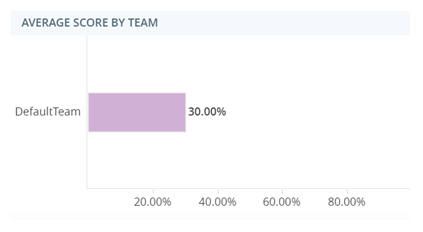
The Average Score by Team widget displays the average evaluation score for each team in a bar graph. Scores are shown as percentages.
Average Score by Section Widget
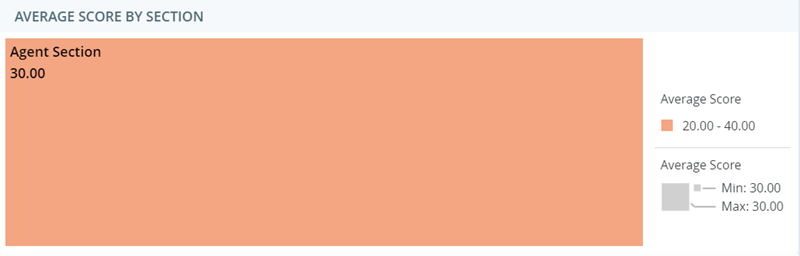
The Average Score by Section widget displays the average score for each section of the evaluation forms. The legend on the right displays the different colors and their corresponding score ranges.
Average Score by Agent Widget
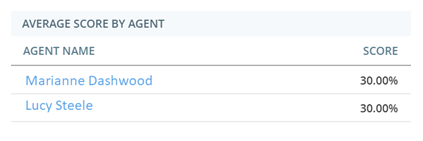
This table displays the average evaluation score for each agent. Scores are shown as percentages. Clicking on an agent in this table will take you to a specialized report focusing on that agent's data. This includes the Question Details widget.
Section and Question Scores Widget
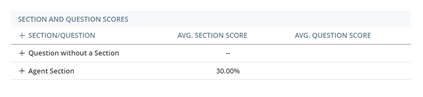
This table displays the average section and question score. Expand a section's row to view a breakdown of the questions in that section, as well as their average scores.
After you choose a form and a date range, this widget takes the percentage score from each evaluation and divides it by the number of evaluations. For example:
-
Number of Evaluations: 6
-
Date Range: 07/13/2026-07/21/2026 (one week)
-
Section: Closing
-
Evaluation Scores:
-
Evaluation 1: 71.43
-
Evaluation 2: 100
-
Evaluation 3: 100
-
Evaluation 4: 100
-
Evaluation 5: 100
-
Evaluation 6: 100
-
The average of these six evaluations would be 95.24%, which would display as the average score.
Question Details Widget
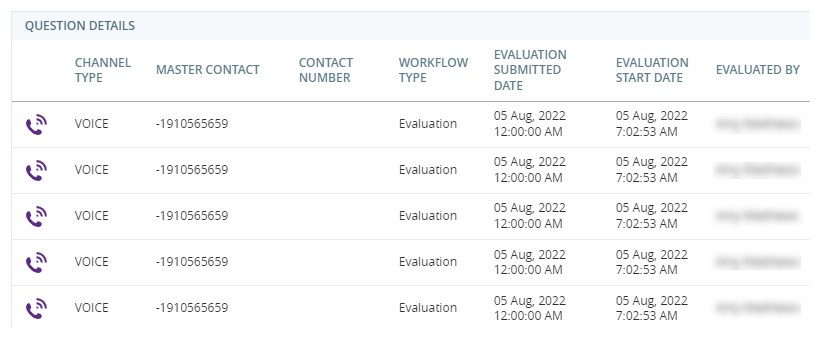
When you select an agent in the Average Score by Agent widget, the Question Details widget appears. It displays evaluation data for the specific agent, as well as basic interaction data. Clicking Play  will play back the interaction and show the evaluation form.
| Column | Description |
|---|---|
| Channel Type | Channel for the interaction, such as voice, email, or chat. |
| Master Contact | Unique ID number given to the contact by the ACD |
| Contact Number | Unique ID number of the evaluated interaction. This is also called the Contact ID. |
| Workflow Type |
Type of evaluation workflow:
|
| Evaluation Submitted Date | Date and time (in UTC) the evaluator submitted the evaluation. |
| Evaluation Start Date | Date and time (in UTC) that the evaluator began the evaluation. |
| Evaluated By | Evaluator who performed the evaluation. |
| Group | Group the agent belongs to. |
| Skill | Skill |
| Interaction Date | Date (in UTC) the evaluated interaction took place. |
| Interaction Duration | Duration of the evaluated interaction. |
| Question | Text of the actual question. |
| Answer | The agent's answer for the question. |
| Score | The score the evaluator gave the agent for the question. |