

Related Products or Features: Business Intelligence (BI) Reports, Quality Management (CXone)
Required permissions: Report Viewer, Evaluations By Team
Required Employee Settings: Can View BI Reports
The Evaluations by Team report shows evaluation data across all channels for your teams and the agents in those teams. This page explains the widgets in the report and the data available in each.
Elinor Dashwood is a supervisor at Classics, Inc who manages multiple teams. She wants to check if anyone on her teams is struggling with their evaluations. She opens the Evaluations by Team report, defines a time period, and selects her teams. She selects the evaluation forms she wants to see the data for. She uses the Bottom 5 Performers widget to see which of her agents are struggling the most. Next, she finds those agents in the Average Score by Agent widget and clicks on each agent's name to see details about their performance. The Agent Details page opens. On that page, she uses the Evaluations widget to identify which evaluations the agent struggled with most.
This report is an advanced Business Intelligence (BI) report. BI reports allow you to perform actions such as drilling down to more details or grouping and exporting data.
The data for this report refreshes every hour. Date and time are displayed in UTC (GMT time zone).
To access and run this report:
-
Select the report you would like to run from the list.
-
Complete the report prompt. The available steps and options will vary for each report.
-
Click Run.
Note that you cannot use Re-Prompt  to make changes to the parameters of this report. There is no report prompt because it includes data for all skills by default. You can filter the report data to change what displays.
For most reports, you can filter the report data using a variety of parameters. You cannot use filters to change certain parameters you selected on the report prompt. However, you can use Re-Prompt to change the parameters of the report.
-
To change report parameters click Re-Prompt
. -
Edit the parameters you want to change. For example, if you want to change the time period you selected before, set Time Period to the new desired range.
-
When you are finished changing the report parameters, click Run.
These filters appear when you first run the report. They also appear when you click Re-Prompt in the top left of the report.
-
Time Period:
-
Evaluation Start Time Period: When evaluations started.
-
Evaluation Submitted Time Period: When evaluations were submitted.
-
Recorded Interaction Time Period: When interactions occurred.
After you click Run at the bottom of the Prompt, you choose a value for the time period, such as Today, Yesterday, and Last 7 Days. For example, if you select Evaluation Start Time Period, then specify a value of Yesterday, the report will display data for the evaluations that started yesterday.
-
-
Hierarchy: The hierarchy of users. Using this filter may increase the amount of time it takes to run the report.
-
Group: The group of users. Using this filter may increase the amount of time it takes to run the report.
-
Team: The team of users.
-
Skill: The skill
 Used to automate delivery of interactions based on agent skills, abilities, and knowledge. of the evaluated interaction.
 -
Form: The Quality Management (CXone) form. If the form name has a # at the end, it is deactivated. If it has an X, it was deleted.
These filters appear when you click Filter  in the top right:
- By Day: The time range for the data in the report.
-
Team: The team of users.
-
Skill: The skill
Used to automate delivery of interactions based on agent skills, abilities, and knowledge. of the evaluated interaction. -
Form: The Quality Management (CXone) form.
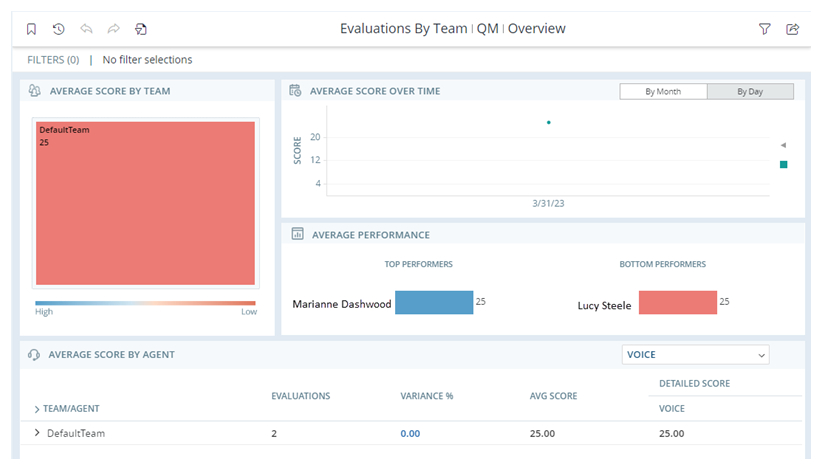
Average Score by Team Widget
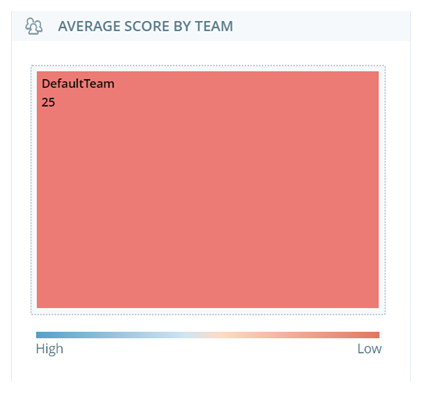
The Average Score by Team widget displays each team's average evaluation score in a colored box. Red indicates a low score, and blue indicates a high score. Select a team to filter the data in the other widgets in the report by that team.
Average Score Over Time Widget
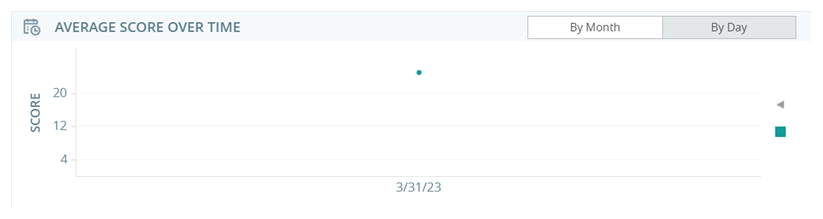
This widget displays the average evaluation score over time for each team as a separate dot. You can view the data by month or by day.
Average Performance Widget
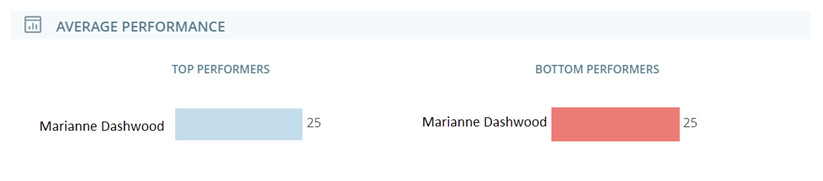
This widget shows:
-
Top Performers: The agents with the highest evaluation scores from all teams included in the report.
-
Bottom Performers: The agents with the lowest evaluation scores from all teams displayed in the report.
Average Score by Agent Widget
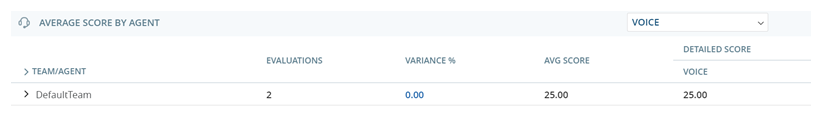
This widget displays the average evaluation scores in each channel for the different agents in each team. It also shows the variance in their average scores from the average team score. The agents are grouped by their teams. Expand the teams to view the agents.
Click an agent name or the View link next to the agent name to drill-down into a detailed report for that agent.
Click the channel drop-down at the top of the widget to select the channels to include in the table. Only supported digital channels appear in this drop-down.
Evaluation Score Trend Widget
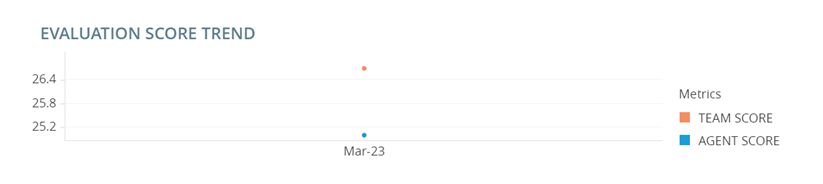
When you select an agent in the Average Score by Agent widget, the Evaluation Score Trend widget appears. This widget shows:
-
The agent's average score over a defined period of time.
-
The team's average score over the same period of time.
You can use this widget to compare the agent's average score to the average score of their team.
Evaluations Widget
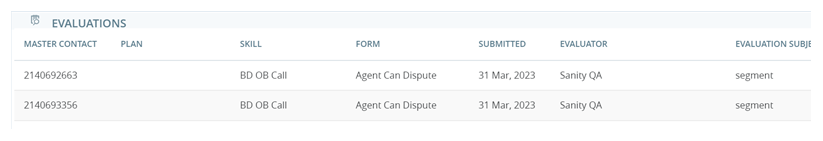
When you select an agent in the Average Score by Agent widget, the Evaluations widget appears. This widget shows the agent's evaluations. It includes the variance of the evaluation score from the agent's average score.
| Column | Description |
|---|---|
| Level | Hierarchy the agent belongs to. The levels you select from the Hierarchy filter at the top of this widget appear as individual columns here. For example, if you select Level 01 and Level 02, columns for Level 01 and Level 02 appear in the report. |
| Master Contact | Unique ID number given to the contact by the ACD |
| Contact Number | Unique ID number of the evaluated interaction. This is also called the Contact ID. |
| Plan | Name of the plan, if applicable. |
| Group | Group the agent belongs to. |
| Agent | Name of the agent the evaluation was assigned to. |
| Skill | Skill |
| Form | Name of the form used for this evaluation. |
| Evaluation Submitted Date |
Date and time (in UTC) the evaluator submitted the evaluation. |
| Evaluation Start Date | Date and time (in UTC) that the evaluator began the evaluation. |
| Evaluator | Name of the evaluator who performed the evaluation. |
| Evaluation Subject |
Possible values include:
|
| Variance % | Difference between this score and the average score of the agent for all evaluations. |
|
Score % |
Evaluation score as a percentage. If the score is edited in the evaluation, it is updated in the report. |
| Total Score | Actual evaluation score. |
| Maximum Score |
Maximum score an agent could have received for the entire form. |
|
Channel Type |
Channel for the interaction, such as voice, email, or chat. |
| Interaction Date | Date (in UTC) the evaluated interaction took place. |
| Interaction Duration | Duration of the evaluated interaction. The duration is in the format HH:MM:SS. |
| Direction |
Direction of the interaction:
|
| Workflow ID | Unique ID of the evaluation. |
| Play | Click Play  to play back the interaction. to play back the interaction. |