

Related Products or Features: Business Intelligence (BI) Reports, WFM
Required Permissions:Report Viewer, Time Utilization Report
Required Employee Settings: Can View BI Reports
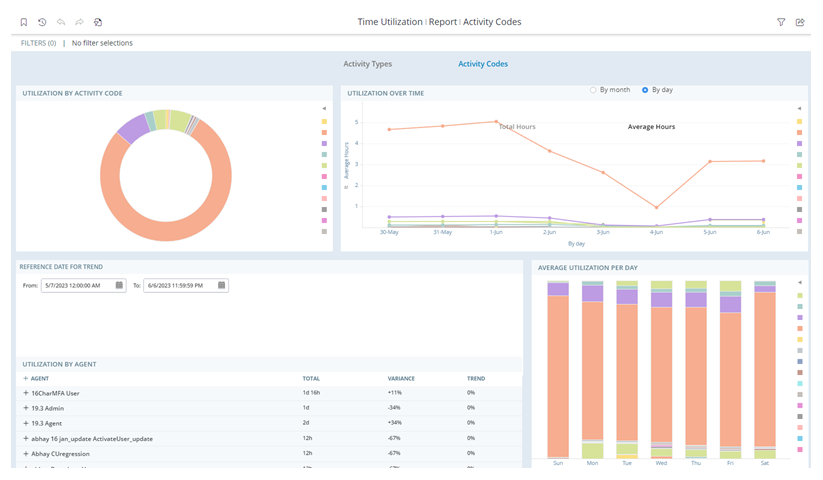
The Time Utilization report displays data about scheduled agent activities. You can use this report to review how much time agents are spending in each activity. To view the data by activity type, select Activity Types at the top of the report. To view the data by activity code, select Activity Codes.
This report is an advanced Business Intelligence (BI) report. BI reports allow you to perform actions such as drilling down to more details or grouping and exporting data.
The data for this report refreshes every hour. Date and time are displayed in UTC (GMT time zone).
To access and run this report:
-
Select the report you would like to run from the list.
-
Complete the report prompt. The available steps and options will vary for each report.
-
Click Run.
Note that you cannot use Re-Prompt  to make changes to the parameters of this report. There is no report prompt because it includes data for all skills by default. You can filter the report data to change what displays.
For most reports, you can filter the report data using a variety of parameters. You cannot use filters to change certain parameters you selected on the report prompt. However, you can use Re-Prompt to change the parameters of the report.
-
To change report parameters click Re-Prompt
. -
Edit the parameters you want to change. For example, if you want to change the time period you selected before, set Time Period to the new desired range.
-
When you are finished changing the report parameters, click Run.
The Time Utilization report has four widgets that present activity data.
Utilization by Activity Code/Type Widget
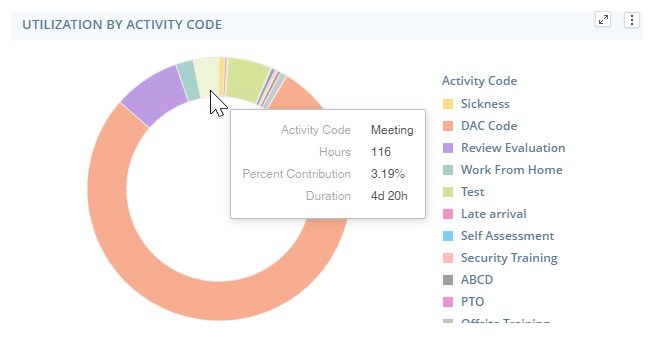
The Utilization by Activity Code/Type widget shows the percentage of time agents spent in each activity out of the total time they worked. The legend on the right displays the different colors in the chart and their corresponding activities.
Utilization Over Time Widget
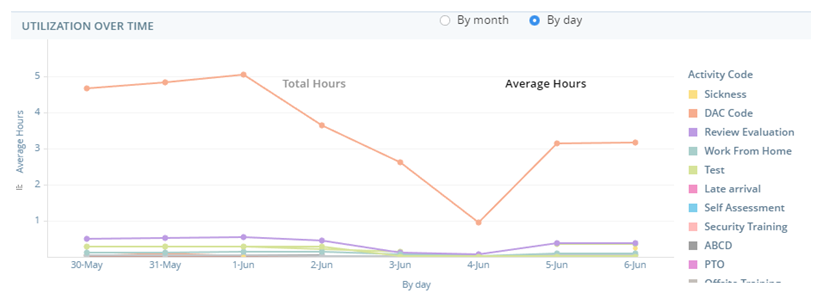
The Utilization Over Time widget displays the amount of time, in hours, agents spent in each activity. Each line on the graph represents an activity. The legend on the right displays the different colors in the graph and their corresponding activities. The options at the top of the widget allow you to choose whether you want to view the data By month or By day. To view the total time agents spent in each activity, select Total Hours at the top of the graph. To view the average time agents spent in each activity, select Average Hours.
Utilization by Agent Widget
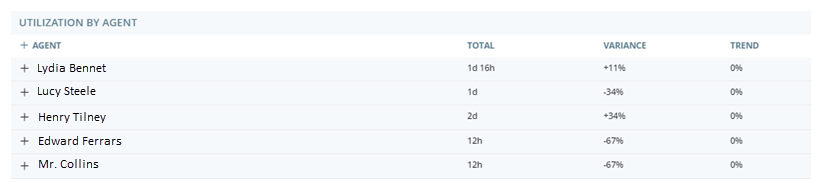
The Utilization by Agent widget displays these columns:
|
Column |
Description |
|---|---|
|
Agent |
The agent's name. |
| Total | The sum of the scheduled time for each agent. |
| Variance | How the agent's time utilization compares to the average time utilization across all agents. |
| Trend | How the agent's scheduled utilization in the filtered time range compares to their scheduled utilization defined in Reference Date for Trend. |
Expand an agent's row to view the activity types the agent spent their time on. When expanded, the variance and trend displayed are for the specific activity. When collapsed, the variance and trend displayed are for the agent's total scheduled hours.
Average Utilization Per Day Widget
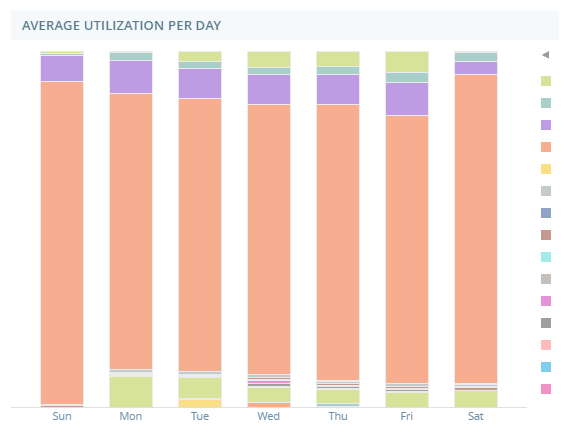
The Average Utilization Per Day widget displays the average amount of time agents spent in each activity on each day of the week. For example, the bar for Monday displays the average amount of time agents spent on each activity on Mondays.
The legend on the right displays the different colors in the chart and their corresponding activities.
Elinor Dashwood is a supervisor at Classics, Inc. She wants to make sure her team of agents have a good balance of activities. She opens the Time Utilization report, defines a time period, and selects her team. She uses the Average Utilization by Day widget to view the average amount of time her agents are spending in each activity. She notices that they spend much less time in breaks on Fridays than the other days. She edits her agents' schedules to fix this.