

Related Products or Features: Business Intelligence (BI) Reports, WFM
Required Permissions: Report Viewer, WFM Intraday Report
Required Employee Settings: Can View BI Reports
The Intraday report shows weekly forecasted data by skills for the selected week. It enables you to compare the actual data with the forecasted data, and spot areas where you can plan better.
This report is an advanced Business Intelligence (BI) report. BI reports allow you to perform actions such as drilling down to more details or grouping and exporting data.
The data for this report refreshes every hour. Date and time are displayed in UTC (GMT time zone).
To access and run this report:
-
Select the report you would like to run from the list.
-
Complete the report prompt. The available steps and options will vary for each report.
-
Click Run.
Note that you cannot use Re-Prompt  to make changes to the parameters of this report. There is no report prompt because it includes data for all skills by default. You can filter the report data to change what displays.
For most reports, you can filter the report data using a variety of parameters. You cannot use filters to change certain parameters you selected on the report prompt. However, you can use Re-Prompt to change the parameters of the report.
-
To change report parameters click Re-Prompt
. -
Edit the parameters you want to change. For example, if you want to change the time period you selected before, set Time Period to the new desired range.
-
When you are finished changing the report parameters, click Run.
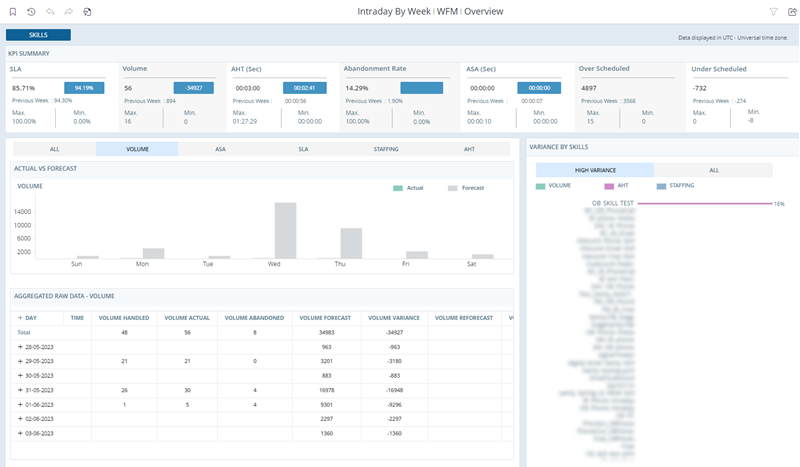
The Intraday report has four widgets that present actual and forecasted data.
KPI Summary Widget
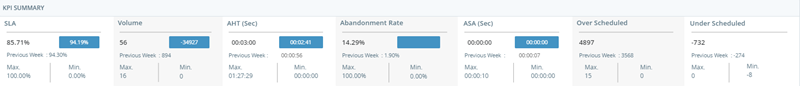
The KPI Summary widget lists these seven metrics:
-
SLA: Service Level Agreement. The percentage of total interactions that agents handled within the defined service level agreement threshold. This metric also shows the total variance from the forecast. This variance value can be positive or negative.
-
Volume: The total volume of interactions at a specific time.
-
AHT: Average Handle Time. The average amount of time, in seconds, that an agent spent handling a contact.
-
Abandonment Rate: The percentage of inbound contacts abandoned by the callers prematurely.
-
ASA: Average Speed of Answer. The average amount of time, in seconds, it took an agent to answer an interaction after the contact chose the option to speak to an agent.
-
Over Scheduled: The number of times more agents worked than necessary. Provides values for the selected time period.
Calculation: Sum IF (Scheduled Agents - Required Agents) > 0
-
Under Scheduled: The number of times less agents worked than necessary. Provides values for the selected time period.
Calculation: Sum IF (Scheduled Agents - Required Agents) < 0
The widget also displays these values for each metric:
-
Total variance from forecast. This value can be positive or negative.
-
The previous week's performance for the metric.
-
The maximum and the minimum value of each metric for the selected time period.
Actual vs Forecast Widget
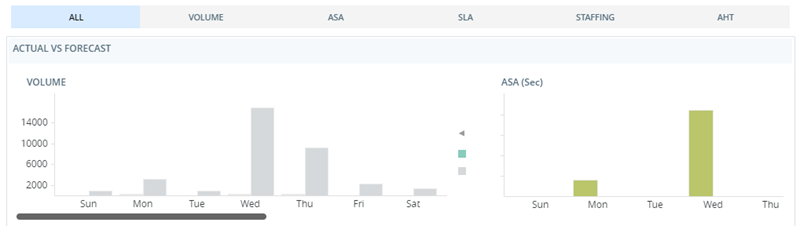
The Actual vs Forecast widget displays actual and forecasted data for these metrics:
-
Volume: The total volume of interactions at a specific time.
-
ASA: Average Speed of Answer. The average amount of time, in seconds, it took an agent to answer an interaction after the contact chose the option to speak to an agent.
-
SLA: Service Level Agreement. The percentage of total interactions that agents handled within the defined service level agreement threshold. This metric also shows the total variance from the forecast. This variance value can be positive or negative.
-
Staffing:
-
AHT: Average Handle Time. The average amount of time, in seconds, that an agent spent handling a contact.
By default, the widget displays data for all metrics. You can compare them and spot areas where you may need to update the schedule. You can also select a metric to view its data alone by clicking one of the these tabs at the top of the widget:

Selecting a metric in the Actual vs Forecast widget also filters data in the Aggregated Raw Data widget.
Aggregated Raw Data Widget
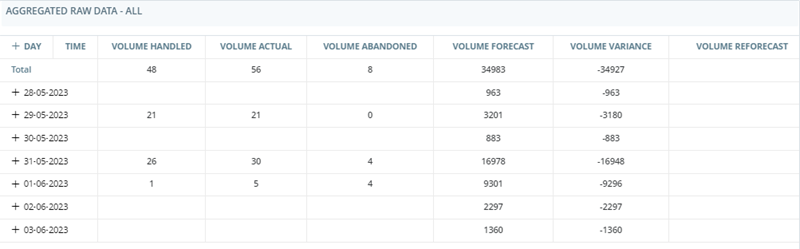
The Aggregated Raw Data widget shows the combined data for all metrics for each day in the week. Click the plus sign next to a date to see the details about interactions at specific times.
By default, the widget displays data for all metrics. If you select a metric in the Actual vs Forecast widget, the data in the Aggregated Raw Data widget will only display data for that metric. The widget displays different columns for each metric. The following sections explain which columns appear for each metric.
Volume Metrics
The Aggregated Raw Data widget displays volume metrics if you select All or Volume in the Actual vs Forecast widget.
|
Column |
Description |
|---|---|
|
Volume Answered |
Number of interactions that were handled every 15 minutes. |
| Volume Actual | Number of interactions that were handled and abandoned every 15 minutes. |
| Volume Abandoned | Number of interactions that were abandoned every 15 minutes. |
| Volume Forecast | Original forecasted value for that time of the day. |
| Volume Variance | Difference between the actual and forecast values. |
| Volume Reforecast | New forecast for the rest of the day, based on incoming data from the ACD |
| Volume New Variance | Difference between the reforecast and the actual trend coming from the ACD. Shows data only when reforecast is enabled. |
| % Volume Abandoned | Percentage of abandoned calls every 15 minutes. |
ASA and AHT Metrics
The Aggregated Raw Data widget displays ASA and AHT metrics if you select All, ASA, or AHT in the Actual vs Forecast widget:
-
ASA: Average Speed of Answer. The average amount of time it took an agent to answer an interaction after the contact chose the option to speak to an agent.
-
AHT: Average Handle Time. The average amount of time an agent spent handling an interaction.
|
Column |
Description |
|---|---|
|
ASA Actual |
Current Average Speed of Answer as it comes in from the ACD |
| ASA Forecast | Original forecasted Average Speed of Answer for that time of the day. |
| ASA Variance | Difference between the actual and forecasted Average Speed of Answer. |
| ASA Reforecast | New Average Speed of Answer forecast for the rest of the day, based on incoming data from the ACD. Shows data only when reforecast is enabled. |
| ASA New Variance | Difference between the Average Speed of Answer reforecast and the actual trend coming from the ACD. Shows data only when reforecast is enabled. |
|
AHT Actual |
Current Average Handle Time as it comes in from the ACD |
| AHT Forecast | Original forecasted Average Handle Time for that time of the day. |
| AHT Variance | Difference between the actual and forecasted Average Handle Time. |
| AHT Reforecast | New Average Handle Time forecast for the rest of the day, based on incoming data from the ACD. Shows data only when reforecast is enabled. |
| AHT New Variance | Difference between the Average Handle Time reforecast and the actual trend coming from the ACD. Shows data only when reforecast is enabled. |
SLA Metrics
The Aggregated Raw Data widget displays SLA metrics if you select All or SLA in the Actual vs Forecast widget. SLA (service level agreement) is the percentage of total interactions that agents handled within the defined service level agreement threshold.
|
Column |
Description |
|---|---|
|
SLA Actual |
Current value for the metric as it comes in from the ACD |
| SLA Forecast | Original forecasted value for the metric as it comes in from the forecasted staffing plan. The SLA value here is defined when forecasting, while the SLA value for the SLA Actual column comes from the ACD. This means that there might be different values for the same metric. |
| SLA Variance | Difference between the actual and forecasted values. |
| SLA Reforecast | New forecast for the rest of the day, based on incoming data from the ACD. Shows data only when reforecast is enabled. |
| SLA New Variance | Difference between the reforecast and the actual trend coming from the ACD. Shows data only when reforecast is enabled. |
Staffing Metrics
The Aggregated Raw Data widget displays staffing metrics if you select All or Staffing in the Actual vs Forecast widget.
|
Column |
Description |
|---|---|
|
Staffing Actual |
Full-time equivalent (FTE) of agents that were considered open by the ACD |
| Staffing Required | Number of agents required to handle the interactions within that time interval. The number comes directly from the forecast or staffing plan used to generate the schedule. |
| Staffing Actual Variance | Difference between the actual number of open agents and the required number from the forecast. |
| Staffing Scheduled | Number of agents that are scheduled to be open to handle interactions within that time interval. |
| Staffing Scheduled Variance | Difference between the original number of agents scheduled to be open and the required number from the forecast. |
Variance by Skills Widget
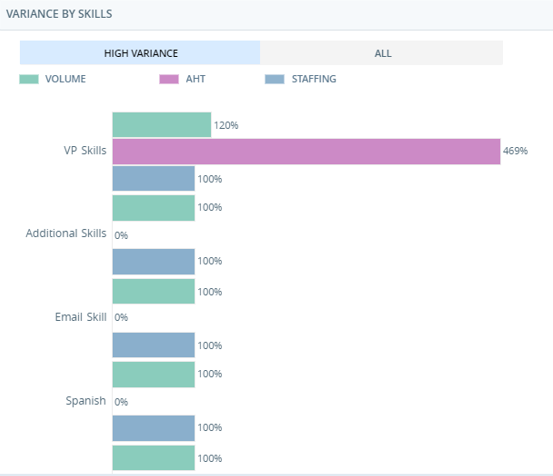
The Variance by Skills widget displays the top five skills that have the highest variance and need improvement. You can also see all the skills and their variance percentage between the actual and forecasted value.
In this widget, the variance is always displayed by volume, AHT, and staffing. The skill with the highest variance in volume is always displayed at the top.