

Related Products or Features: Business Intelligence (BI) Reports, WFM
Required Permissions: Report Viewer, WFM Adherence Report
Required Employee Settings: Can View BI Reports
The Adherence report displays data about agent productivity. It displays adherence and conformance metrics, including:
-
In Adherence: The amount of time the agent followed their schedule.
-
Out of Adherence: The amount of time the agent did not follow their schedule.
-
In Conformance: The amount of time the agent worked when they were scheduled to work.
-
Out of Conformance: The amount of time the agent did not work when they were scheduled to work.
Adherence is calculated every three hours of a shift rather than at the end of a shift. This does not apply to time when agents aren't scheduled. If an agent was not scheduled for work, but worked anyway, no value will be displayed for conformance metrics.
Data for this report is refreshed every three hours. Also, updates to agent schedules within the previous three months will be considered for adherence calculations (or recalculations), after the schedules have been republished.
Adherence is calculated only for the period when an agent is active. After an agent is deactivated, their future schedules are excluded from adherence calculations and no longer appear in the report, ensuring supervisors see only relevant data. Adherence data from the agent’s active period remains available.
Conformance is calculated by dividing working minutes by scheduled minutes. It is shown as a percentage.
Marianne Dashwood, an agent at Classics, Inc., is scheduled to work eight hours, from 9:00 AM to 5:00 PM. She works from 9:30 AM to 5:30 PM. Because she worked eight hours, Marianne is in 100% conformance. But because she didn't work exactly during her schedule, she is not in 100% adherence.
From 9:00 to 9:20, she has an adherence value of 0 minutes. From 9:20 to 9:40, she has an adherence value of 10 minutes.
The Adherence report has five widgets that present adherence and conformance metrics. This report supports up to one month of updated historical data. You can use this report to identify potential or existing adherence and conformance issues for your agents. You can filter by day, scheduling unit, or agent.
This report is an advanced Business Intelligence (BI) report. BI reports allow you to perform actions such as drilling down to more details or grouping and exporting data.
The data for this report refreshes every hour. Date and time are displayed in UTC (GMT time zone).
To access and run this report:
-
Select the report you would like to run from the list.
-
Complete the report prompt. The available steps and options will vary for each report.
-
Click Run.
Note that you cannot use Re-Prompt  to make changes to the parameters of this report. There is no report prompt because it includes data for all skills by default. You can filter the report data to change what displays.
For most reports, you can filter the report data using a variety of parameters. You cannot use filters to change certain parameters you selected on the report prompt. However, you can use Re-Prompt to change the parameters of the report.
-
To change report parameters click Re-Prompt
. -
Edit the parameters you want to change. For example, if you want to change the time period you selected before, set Time Period to the new desired range.
-
When you are finished changing the report parameters, click Run.
The Adherence report has five widgets that present adherence and conformance metrics.
Agent Summary Widget
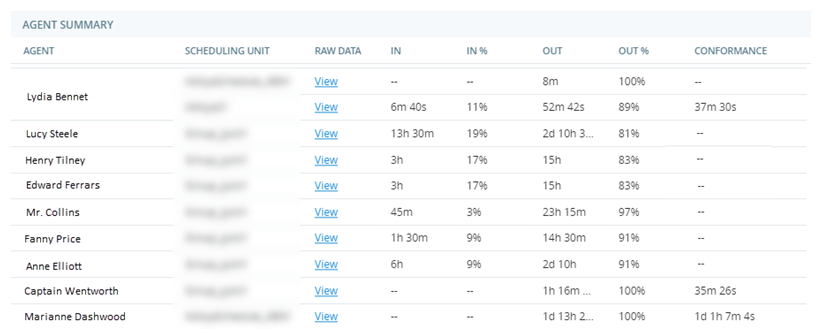
The Agent Summary widget displays:
-
The total time each agent was scheduled for activities.
-
The total time each agent actually spent on scheduled activities.
-
The total time each agent was in adherence.
-
The total time each agent was out of adherence.
-
The total time each agent was in conformance.
-
The total time each agent was out of conformance.
You can select an agent to focus the data in the report on that agent. To select multiple agents, hold the Ctrl key. Selecting agents in this widget will filter all of the other widgets in this report to display specific data about those agents. Any null values display blank in the widget table.
You can click View in the Raw data column to see more details. Scheduled activities and actual activities are different.
Elinor Dashwood is a supervisor at Classics, Inc. She wants to see if any of her agents are struggling to remain in adherence or conformance. She opens the Adherence report, defines a time period, and selects her scheduling unit. She looks at the Agent Summary widget and notices that one of her agents, Lucy Steele, spent a lot of time out of adherence. Elinor clicks Lucy's name to see specific data about her. She notices that Lucy was remaining in an After Call Work state![]() The availability status of an agent. for longer than the allotted time. Elinor schedules training with Lucy to review the process for After Call Work.
The availability status of an agent. for longer than the allotted time. Elinor schedules training with Lucy to review the process for After Call Work.
| Column | Description |
|---|---|
| In | The amount of time the agent was in adherence. Displays values in days, hours, minutes, seconds, or a combination of these. For example, if agents were scheduled to be in the activity from 9:00 to 10:00, but were only in the activity from 9:00 to 9:15, their value for In is 15m. |
| In % | Percentage of time the agent followed their schedule. Calculation: (Time spent adhering to schedule / Scheduled time) x 100. |
| Out | The amount of time agents scheduled for the activity were out of adherence. Displays values in days, hours, minutes, seconds, or a combination of these. For example, if agents were scheduled to be in the activity from 9:00 to 10:00, but were only in the activity from 9:00 to 9:15, their value for Out is 45m. |
| Out % | Percentage of time the agent did not follow their schedule. Calculation: (Time spent not adhering to schedule / Scheduled time) x 100. |
| Conformance | The amount of time the agent was in conformance. Displays values in days, hours, minutes, seconds, or a combination of these. For example, if agents were scheduled to be in the activity for 2 hours, but were only in the activity for 30 minutes, their value for Conformance is 30m. |
| Conformance % |
The percentage of time the agent was in conformance. For example, if agents were scheduled to be in the activity for 2 hours, but were only in the activity for 30 minutes, their value for Conformance % is 25%. Calculation: (Time the agent worked / Time the agent was scheduled to work) x 100. |
Elinor Dashwood is a supervisor at Classics, Inc. She wants to know which of her agents have the highest adherence percentages so she can reward them with a bonus. She opens the Adherence report, defines the time period at the past month, and selects her scheduling unit. In the Agent Summary widget, she right-clicks the % In Adherence column and sorts by descending order. The agents with the highest adherence percentages appear at the top.
Agent Adherence Variance Widget
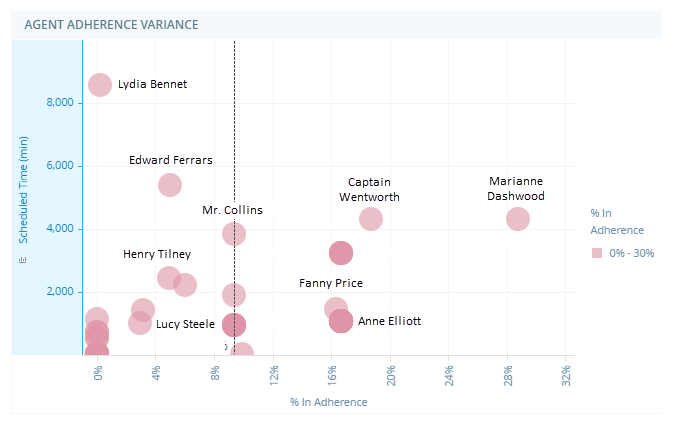
The Agent Adherence Variance widget displays each agent as a separate dot on the graph. The legend on the right displays the different dot colors and the corresponding adherence percentage range. The table below provides a description for each element in the graph.
|
Graph element |
Metric |
|---|---|
| Y-axis | The amount of time (in minutes) the agent was scheduled to work. |
| X-axis | The percentage of time the agent was in adherence. |
|
Dotted line |
The median adherence percentage for the selected agents. |
Activity Summary Widget
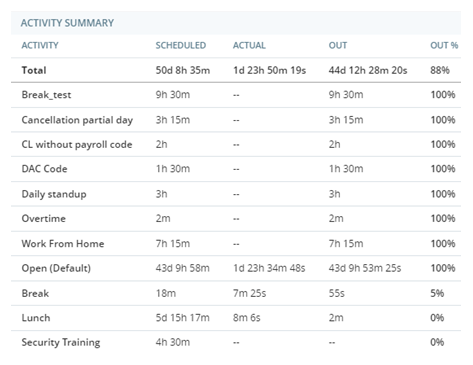
The Activity Summary widget displays:
-
The total scheduled time for each activity compared with the actual time agents performed those activities.
-
The total time the agent spent out of adherence for each activity.
-
The percentage of the original scheduled time the agent spent out of adherence.
-
The total time the agent spent in conformance for each activity.
-
The percentage of the original scheduled time the agent spent in conformance.
| Column | Description |
|---|---|
| Activity | The name of the activity as it appears on agents' schedules. |
| Scheduled | The amount of time the activity was scheduled for agents. Displays values in days, hours, minutes, seconds, or a combination of these. |
| Actual |
The amount of time agents spent in the activity. Displays values in days, hours, minutes, seconds, or a combination of these. |
| Out | The amount of time agents scheduled for the activity were out of adherence. Displays values in days, hours, minutes, seconds, or a combination of these. For example, if agents were scheduled to be in the activity from 9:00 to 10:00, but were only in the activity from 9:00 to 9:15, their value for Out is 45m. |
| Out % |
The percentage of time agents scheduled for the activity were out of adherence. For example, if agents were scheduled to be in the activity from 9:00 to 10:00, but were only in the activity from 9:00 to 9:15, their value for Out % is 75%. Calculation: (Time spent not adhering to schedule / Scheduled time) x 100. |
| Conformance | The amount of time agents scheduled for the activity were in conformance. Displays values in days, hours, minutes, seconds, or a combination of these. For example, if agents were scheduled to be in the activity for 2 hours, but were only in the activity for 30 minutes, their value for Conformance is 30m. |
| Conformance % |
The percentage of time agents scheduled for the activity were in conformance. For example, if agents were scheduled to be in the activity for 2 hours, but were only in the activity for 30 minutes, their value for Conformance % is 25%. Calculation: (Time the agent worked / Time the agent was scheduled to work) x 100. |
Adherence Over Time Widget
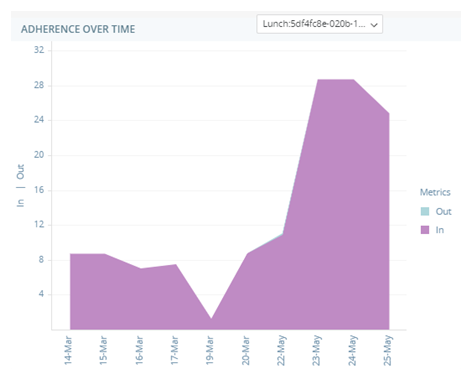
The Adherence Over Time Widget displays how much time agents spent in and out of adherence by day, over the time range you defined when you ran the report. From the drop-down list at the top of the widget, select one or more activities. The chart will display the total amount of time scheduled for the selected activities, as well as the amount of time agents were in and out of adherence.
The table below outlines the scheduled and actual activities that result in agents being in adherence and out of adherence.
| Scheduled Activity | Actual Activity | adherence |
|---|---|---|
| Open | Open | In Adherence |
| Overtime | Open | In Adherence |
| Overtime | InBoundContact | In Adherence |
| Overtime | Break | Out of Adherence |
| Overtime | Meeting | Out of Adherence |
| Overtime | Unknown | Out of Adherence |
| Overtime | Unmapped | Out of Adherence |
OOA Cause Widget
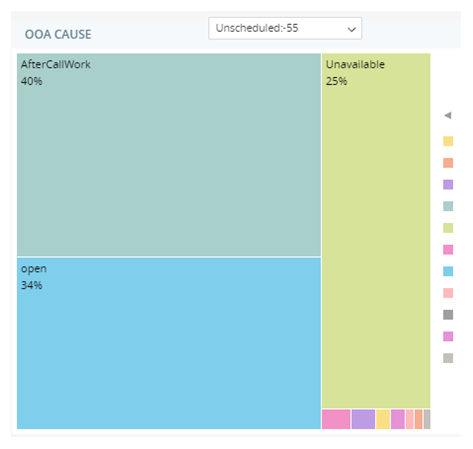
The OOA (Out of Adherence) Cause widget displays the activities agents were actually performing instead of their scheduled activities when they were out of adherence. From the drop-down list in the widget, select at least one scheduled activity. The chart will display the activities the agents performed instead of those selected.