

Related Products or Features: Business Intelligence (BI) Reports, Quality Management (CXone)
Required permissions: Report Viewer, Calibration
Required Employee Settings: Can View BI Reports
The Calibration report helps you to calibrate evaluation forms. During calibration, the evaluation form is sent to a number of users to evaluate. The Calibration report automatically tracks variance between evaluators and individual evaluator performance. You can run the report on different versions of the same evaluation form and see the change in variance between the versions.
This report is an advanced Business Intelligence (BI) report. BI reports allow you to perform actions such as drilling down to more details or grouping and exporting data.
The data for this report refreshes every hour. Date and time are displayed in UTC (GMT time zone).
To access and run this report:
-
Select the report you would like to run from the list.
-
Complete the report prompt. The available steps and options will vary for each report.
-
Click Run.
Note that you cannot use Re-Prompt  to make changes to the parameters of this report. There is no report prompt because it includes data for all skills by default. You can filter the report data to change what displays.
For most reports, you can filter the report data using a variety of parameters. You cannot use filters to change certain parameters you selected on the report prompt. However, you can use Re-Prompt to change the parameters of the report.
-
To change report parameters click Re-Prompt
. -
Edit the parameters you want to change. For example, if you want to change the time period you selected before, set Time Period to the new desired range.
-
When you are finished changing the report parameters, click Run.
These filters appear when you first run the report. They also appear when you click Re-Prompt in the top left of the report.
-
Time Period:
-
Form: The Quality Management (CXone) form. If the form name has a # at the end, it is deactivated. If it has an X, it was deleted.
-
Evaluator: The QM evaluator.
These filters appear at the top of the report after you run it.
-
Report by: View the data by Form or Evaluator.
Data in this Report
The Calibration report has multiple columns that present data attributes and metrics. You can filter the data by:
-
Form—Quickly see the forms and questions that have very high variance between evaluator answers. To filter by form, select Form in the Report By field.
-
Evaluator—Identify evaluators who are consistently over- or under-evaluating evaluation forms and questions. This can help you determine which evaluators may need additional coaching to bring their scores in line with quality standards. To filter by evaluator, select Evaluator in the Report By field.
John Middleton is a quality manager for Classics, Inc. He wants to improve evaluator performance. He opens the Calibration report, defines a time period, selects the forms he wants to analyze, and selects his team. He selects Evaluator in the Report By field to filter by evaluator. He notices Lucy Steele, an evaluator, has high variance. He clicks Lucy's name to get more detail on the variance of the forms and questions Lucy has evaluated.
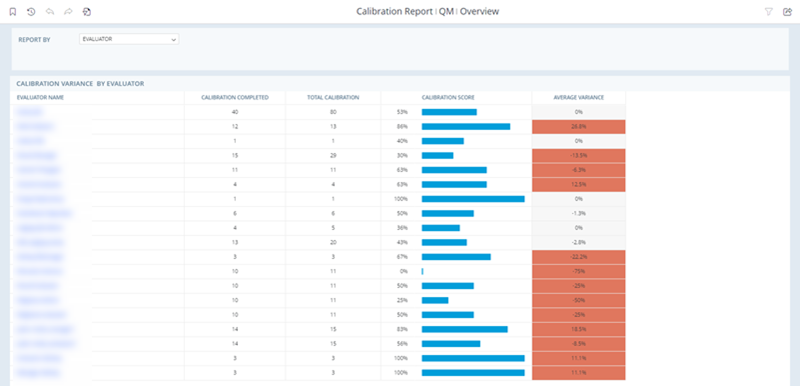
The table below provides a description for each column.
| Column | Description |
|---|---|
| Evaluator Name | Name of the evaluator. Click the evaluator name to drill-down into specific information about that evaluator. |
| Form Name | Name of the form. Click the form name to drill-down into specific information about that form. |
| Calibration Completed | Number of calibrations completed. |
| Total Calibration | Number of calibrations requested. |
| Calibration Score |
Calibration score for the evaluator or form.
|
| Average Variance |
Average variance across all the evaluators or forms. High variance indicates the question is being scored inconsistently by the evaluators. An average variance of 0% doesn't necessarily mean there is no variance. It can mean that positive (easier) and negative (harder) scores have been evened out. For example, if there are two evaluators in the calibration and one scores 5% harder (-5%) and the other scores 5% easier (+5%), the average variance is 0%. |
| Column | Description |
|---|---|
| Form Name | Name of the form. |
| Section | Section of the form. |
| Question | Question in the form. |
| Calibration Score |
Evaluator's calibration score for the question.
|
| Variance |
Evaluator's variance for the question.
|
| Column | Description |
|---|---|
| Section | Section of the form. |
| Question | Question in the form. |
| Calibration Score |
Calibration score for the question.
|
| Variance |
Variance for the question. |