

Intraday gives you a 24-hour look at your day, from 12:00 AM to 11:45 PM. The day is split into 15-minute intervals. Using the intervals and metrics![]() Statistics you can measure to keep track of your contact center., you can see how each skill
Statistics you can measure to keep track of your contact center., you can see how each skill![]() An employee's area of expertise. A skill can be fluency in a specific language or business skills, such as sales or technical support. is performing. You can also compare them with the forecasted data, and spot areas where you may need to update your scheduling.
An employee's area of expertise. A skill can be fluency in a specific language or business skills, such as sales or technical support. is performing. You can also compare them with the forecasted data, and spot areas where you may need to update your scheduling.
Let's say your center has three skills: Inbound phone, Chat, and Tech Support.
You forecasted that your center would receive 100 calls and 50 chat requests per hour during the morning shift.
But what if something unexpected happens? At 11:00, you see that you received only 20 calls per hour, but 90 chat requests.
You might want to adjust your staffing. You can reduce staffing for the Inbound Phone skill, and free up more time for your agents to handle chat requests.
Features in the Intraday Manager:
-
Widgets: The top of the page displays a row with Intraday data in different graphs.
You can collapse the widget row by clicking Options
 > Collapse Widgets.
 -
Intraday table: Underneath the widgets you get a detailed look at the data with exact numbers.
By default, all skills and metrics are displayed in the table when you open Intraday Manager. You can filter the data you want to view. Next time you enter Intraday, you'll see the skills according to what you filtered.
-
Copilot Q&A: Ask WFM questions directly from the Intraday header without leaving the page. Requires a WFM Premium license and Actions to be enabled.
More about Intraday:
-
The forecast data is based on the forecast you used to generate your schedule. Intraday gets updated with the new forecast data once you publish the schedule.
-
By default, the time displayed in Intraday is for the user's local time zone.
Let's say a manager in New York is using Intraday for a scheduling unit in California. The time displayed in Intraday will be according to New York's time zone.
But you can change the time zone from the Settings panel.
-
The data displayed in Intraday is for WEM skills and not ACD skills. Intraday won’t display data for agents or ACD skills that aren’t assigned to a WEM skill.
 See examples
There are five agents that handled English_Calls. There can be cases when the WEM skill isn't assigned to:
-
Agents: Let's say one of those agents isn't assigned to the English_Calls WEM skill in NiCE CXone Admin. In this case, Intraday will show data for only four agents.
-
ACD skills: If the ACD skill isn’t assigned to the English_Calls WEM skill, intraday won’t display data for all five agents.
-
Intraday uses data received from the ACD and the active forecast and schedule management.
Widgets

The Intraday Manager widgets are: Staffing![]() Staffing data for agents that were open during the selected interval., Volume
Staffing data for agents that were open during the selected interval., Volume![]() The total number of interactions, including digital posts and comments, usually within a defined time., or AHT
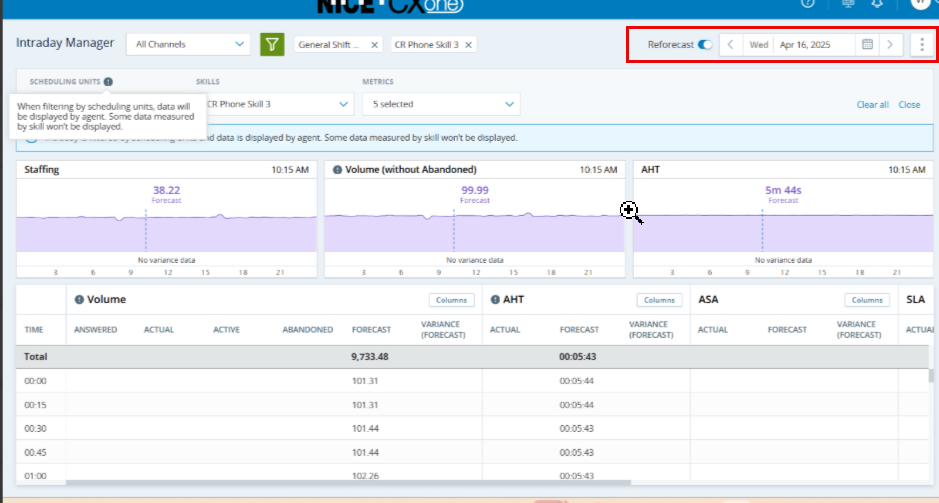
The total number of interactions, including digital posts and comments, usually within a defined time., or AHT![]() Average Handle Time is the average amount of time an agent spent handling an interaction.. When filtering by scheduling unit, the Volume widget doesn't include abandoned
Average Handle Time is the average amount of time an agent spent handling an interaction.. When filtering by scheduling unit, the Volume widget doesn't include abandoned![]() Interactions that enter the system but end before reaching an agent, such as when the contact hangs up. data. The widget title becomes Volume (without Abandoned).
Interactions that enter the system but end before reaching an agent, such as when the contact hangs up. data. The widget title becomes Volume (without Abandoned).
On top of the widgets, you see the widget name (Staffing, Volume, or AHT) and the interval that the data is displaying. For example, you're looking at the data for the 11:00 interval. The displayed time is 11:00.
The widgets display data for the latest completed interval, and they represented in a dotted vertical line. Let's say you look at the widgets at 11:22. The displayed data is for the 11:00 interval and there is a dotted line in the graph.
You can hover over the graph to see data for different intervals. The interval you're hovering over is represented in a solid vertical line. For example, you hover over one of the graphs at 9:00. The displayed data for each widget changes according to the 9:00 interval, including the Variance, Actual, Forecast, and Reforecast values. In the corner of the widgets, the time changes to 9:00. The dotted line continues to represent the latest completed interval.
Keep in mind, you cannot hover over intervals that don't have data. If you do, the solid line jumps to the closest interval with data.
Daily AHT in the AHT widget
The AHT widget can display Daily AHT, which is the current average handle time for contacts from the start of the day to the latest completed interval. This metric helps you answer the question: “What is the current AHT for my contact center?”
Daily AHT is available only for tenants who:
-
Use CXone ACD integrated with CXone WFM
Daily AHT is not displayed for:
-
Third party ACDs
-
CXone ACD tenants that use the WCE paradigm
-
Side-by-side tenants
-
ACD Hub or other Non CXone ACD (such as UCCX) configurations
When available to the tenant, Daily AHT appears in the AHT widget header as a separate value, in addition to the intraday interval AHT.
How Daily AHT is calculated
Daily AHT is the average handle time for contacts from the start of the day to the latest completed interval. It uses aggregated intraday data for contacts that have ended or been completed.
Daily AHT is calculated using the following formula:
-
Daily AHT: SUM(AHT*(Answered+Active))/SUM(Answered)
For CXone ACD, the Handle Time received from the ACD already includes Hold Time.
Daily AHT does not change or replace any existing AHT values in the table or widgets. It is an additional data point for real time monitoring.
Daily AHT follows these display rules:
-
Format: hh:mm:ss (for example, 00:02:30).
-
Start of day: At 00:00, before any data is received, Daily AHT shows --.
-
First interval: As soon as data is received for the first interval of the day, the Daily AHT is calculated and displayed.
-
No data / future date / error:
-
If there is no data, the selected date is in the future, or an internal error occurs, the value shows --.
-
If the calculated value is zero, the field displays 00:00:00. This indicates that no calls were made, it was a day off, or the contact center was closed.
-
-
Missing or blank intervals: If data is missing or blank for one or more intervals during the day due to a technical issue, Daily AHT continues to display the last successfully calculated value. Intervals with 0 or blank AHT are ignored in the calculation.
-
Past dates: For past dates where intraday data is available, Daily AHT is calculated with the same formula and displayed for that day.
Behavior with filters
Daily AHT always respects the filters you apply in Intraday Manager:
-
It is recalculated based on the currently selected Scheduling Units, Skills, and any other supported filters.
-
When you change filters, Daily AHT is recalculated using only the interactions that match the new filters, from the start of the selected day up to the latest interval.
-
Variance, Actual, Forecast, and Reforecast values. The values come from the Intraday table.
If one of the values is missing, it isn't displayed in the widget. For example, there's no forecast data. The widget displays the Variance, Actual, and Reforecast values, without Forecast.
The Variance is the percentage between the Actual and the Forecast value. For example, the Actual value is 20 and the Forecast is 50 in the Staffing widget. In this case, the variance percentage is -60%.
Keep in mind, it can take few minutes till the data appears on the screen as the ACD has few minutes of process time after the interval ends before sending it to WFM. For example, the 11:15 interval ends at 11:30. When looking at the widget, you immediately see the Forecast data but the Actual data could be displayed until 11:35. If the Actual data doesn't get updated, there might be a delay getting the data from your ACD provider.
-
Under the values, you see line graphs for the values, measured over the time of the day. The color of each graph represents a different value. Each graph displays the volume of the value (vertical axis) with 15-minutes intervals (horizontal axis).
-
Under the graph there's a bar indicating the variance thresholds (color coded), if enabled. The variance threshold is also displayed as a heatmap under the graph.
-
A time bar at the bottom of the widgets. The time is based on the actual working hours of your organization, and not full days. For example, the widget can show you data from nine in the morning to five in the afternoon (9:00–17:00).
How time is displayed in the widgets
The start and end of each day is based on the scheduling unit's operating hours and received data.
For example, here are the operating hours for three scheduling units:
-
SU1: 8:00–16:00
-
SU2: 8:30–16:30
-
SU3: 9:00–17:00
The widgets display data from 08:00 until 17:00, even if you filter to display only one of the scheduling units. If there's data received beyond the operating hours, the time is adjusted accordingly. In this example, let's say that an agent starts handling interactions early, at 7:00. In this case, the time in the widgets starts from 7:00 until 17:00.
-
The data changes when you change the day you choose to display. If you're looking at:
-
Today: The graphs display data from the beginning of the day until your current time.
-
Tomorrow: The graphs display data only for Forecast, if available.
-
A future day: The graphs only display the forecast data of the published schedule. Let's say you generated a schedule for the next two weeks. You can see forecast data in Intraday for those two weeks.
-
A day in the past: The graphs display all the data from that day, with a red line that corresponds with the current 15-minute interval. The Actual, Forecast, and Reforecast values are according to that red line.
Let's say you open the Intraday Manager at 11:22 on Tuesday, and look back at the intraday data for Monday. The widgets are displaying the values from the 11:00-11:15 interval on that day.
The Volume widget becomes the Volume (without abandoned) widget, displaying the number of calls handled by the selected scheduling units.
Because the widget displays data for answered interactions, there might be a difference between the data for Actual and Forecast:
-
The Forecast value includes data for both answered and abandoned interactions.
-
The Actual value includes data for answered calls only. Abandoned interactions aren't considered answered.
Intraday Table
The table displays a breakdown of metrics in 15-minute intervals for the selected day. The data for each interval gets updated after a few minutes due to ACD processing time. For example, you'll see data for the 11:00 interval at around 11:20. Keep in mind, the displayed time is according to your local time zone.
By default, all skills and metrics are displayed in the table. You can filter the data you want to view. Next time you enter Intraday, you'll see the skills according to what you filtered.
To expand the table by collapsing the widget row, click Options > Collapse Widgets.
The highlighted Total row shows the aggregated results of each column. For the AHT, SLA, and ASA metrics, it's the aggregated average.
Let's say you open the Intraday Manager at 11:22. The table displays data for each interval up to the 11:15 row. The Total row displays the aggregated results of each column until the 11:00 interval.
Backlog is the number of interactions that are still waiting in the queue and have not yet been answered, abandoned, or ended. The ACD reports backlog in real time at the interval level. At each interval, it sends the current backlog value for each skill, so you can see how much work is still waiting to be handled in that skill.
The Backlog column is a special case where the Total row displays the value from the last period rather than summing or averaging. This is because the backlog value can include the same interaction appearing in multiple intervals, and summing these values would not accurately reflect the true backlog. It gives you a better picture about how the status was at the end of the day as compared to the beginning of the day.
For example, if the last updated interval is 10:00 and the backlog values are 557 at 9:30, 558 at 9:45, and 559 at 10:00, the total row will display 559, as it represents the backlog at the last interval.
Keep in mind:
-
The AHT is calculated per interval and this is a weighted AHT of the entire day.
-
The actual data in the Volume metric includes answered calls, abandoned calls, and active calls (active if TTI is implemented). This means that an interaction lasting over 15 minutes is counted multiple times. For example, if you received one call that lasted 10 minutes (starting and ending in the same interval) and another call that lasted 20 minutes (spanning over two intervals), the total actual data would be 3.
-
When looking at a future day, the total value of forecast data is for the full day.
Data in the table can be displayed based on channel type: Real time![]() Real-time interactions that must be handled immediately, such as calls or face-to-face meetings., Deferrable
Real-time interactions that must be handled immediately, such as calls or face-to-face meetings., Deferrable![]() Interactions that can be handled later, such as emails., or All channels.
Interactions that can be handled later, such as emails., or All channels.
When you filter by Skill, the available options depend on the selected channel type. For example, if you select Deferrable channels, only skills with the deferrable type can be chosen.
The skills displayed for each channel type are saved when switching between channel types. Let's say you selected Real-time channels. Then you set 10 out of 15 real-time skills. Once you choose Deferrable channels, those 10 skills won't be displayed because they aren't deferrable. When you return to Real-time channels, the 10 skills are selected automatically.
You can see the channel type of each skill on the WEM Skills page. Every skill can be assigned to one channel. For example, you are looking at a skill called English call. The skill is assigned to the Voice channel. Voice channels are real-time interactions.
Keep in mind, Intraday displays data for inbound and outbound (including dialer![]() A service that automatically calls a list of customers.) interactions.
A service that automatically calls a list of customers.) interactions.
Users with Cisco UCCX cannot filter by channels or scheduling units.
In the Intraday table, some metrics are calculated by skills, not agents. For example, the Abandoned column in Volume. These metrics cannot be split by a group of agents.
Let's say there are three scheduling units, and you are filtering by one of them. You won't be able to see the Abandoned data. That data isn't measured by agents, but by how many interactions were abandoned per skill.
Because some metrics are calculated by skill:
-
Columns containing data that cannot be calculated are empty. This includes:
-
All ASA columns
-
All SLA columns
-
The Actual and Abandoned columns in Volume.
-
-
There may be a discrepancy between the Actual and Forecast columns in Volume.
Forecast data is displayed by skill, and Actual data is by agent. The forecast cannot be by agent because it's generated by skill when creating a staffing plan. The discrepancy can happen because the Forecast and Actual data come from different sources.
The forecasted volume of a skill is 100 interactions for 12:00. Three scheduling units can handle that skill.
It's now 13:00 and you check the 12:00 interval. When you aren't filtered by scheduling unit, you see:
-
Forecast: 100
-
Actual: 98
This means that the call center received 98 interactions during that time, and that the forecast was almost accurate.
When filtering by one of the scheduling units, Intraday removes data from the two unselected units. You see:
-
Forecast: 100
-
Actual: 75
The Actual data shows how many interactions the selected scheduling unit answered, but the forecast is still for skill. This way, you see how many interactions this unit answered out of the forecasted amount.
You can color code the cells in the variance columns to highlight when the variance is high or low. The color is defined according to the variance threshold of the metric.
This way, you can see if there are metrics that require your attention.
What You See in the Table
The data in the table can be displayed according to deferrable![]() Interactions that can be handled later, such as emails. or real-time
Interactions that can be handled later, such as emails. or real-time![]() Real-time interactions that must be handled immediately, such as calls or face-to-face meetings. channels. You can also display the data by All channels. Keep in mind, Intraday displays data for inbound and outbound (including dialer
Real-time interactions that must be handled immediately, such as calls or face-to-face meetings. channels. You can also display the data by All channels. Keep in mind, Intraday displays data for inbound and outbound (including dialer![]() A service that automatically calls a list of customers.) interactions.
A service that automatically calls a list of customers.) interactions.
Metrics in the table:
This represents Average handle time reported by the ACD. WFM skill with multiple ACD skills AHT will be calculated based on weighted average of all the ACD skills for that WFM skill.
-
The total AHT shows you the average of all intervals.
-
The Total AHT is calculated per volume and not skill.
Let's say for Skill A, the volume is 3 and the AHT is 15 minutes. For Skill B, the volume is 2 and the AHT is 10 minutes. The total AHT is calculates by the volume, which is 5 (3 from Skill A + 2 from Skill B). The AHT is 13:00:
(3×15 + 2×10) ÷ 5 = 13
-
Actual: The current value for the metric as it comes in from the ACD.
-
Forecast: The original forecasted value for that time of the day.
If the forecast data in Intraday and the forecast job isn't the same
When you create a forecasting job, the system calculates the forecast data in two stages. First, the data is generated in Forecast Data (step 3 of forecasting), based on the required skills. Second, the system can improve the forecast data by distributing the workload across multiple scheduling units. After defining the Staffing Parameters (step 4), the data is regenerated. This time, the calculation also considers the scheduling units that can handle the interactions. This ensures that the forecast data is as accurate as possible. The forecast data is updated in Staffing (step 5).
When you generate a schedule based on a forecasting job, the forecast data is based on the data in step 5. The final forecast data is also displayed in the Forecast columns in Intraday.
-
Variance: The difference between the actual and forecasted values.
-
Reforecast: A new forecast for the rest of the day, based on incoming data from the ACD. Shows data only when reforecast is enabled.
-
Variance (Reforecast): The difference between the reforecast and the actual trend coming from the ACD. Shows data only when reforecast is enabled.
The volume metric represents the total volume reported by the ACD.
Columns in the table:
-
Received: Number of interactions received during that interval, regardless of whether they were answers. Intraday started collecting Received data from August 2024. Data prior to that isn't displayed.
-
Answered: The number of interactions that started during that interval.
-
Active: The number of interactions that are ongoing from the previous interval.
-
Abandoned: Number of interactions that were abandoned during that interval.
When filtering by scheduling unit (not available for users with Cisco UCCX), the data for this metric will be empty. The data intraday receives is per skill, and it can't be split into scheduling units.
-
Actual: Number of answered, active (if exists with NICE ACD integration), and abandoned interactions during that interval:
Actual = Answered+Active+Abandoned
Keep in mind, the Actual data in the Total row includes the Active data. It includes Active to show the total amount of interactions per interval. This means an interaction can be included more than once, if longer than 15 minutes.
How Actual Volume is calculated for user with NiCE CXone ACD
For phone calls in Intraday Manager, actual volume is calculated as:
If you are using ACD, the actual volume is the sum of these values coming from the ACD (see Data Dictionary):
Actual Volume = Handled + Abandoned + Active
-
Handled: Interactions that were answered and completed during the interval
-
Abandoned: Interactions that ended before reaching an agent
-
Active: Interactions still in progress from a previous interval. Included only for CXone WFM (TTI) users
CXone WFM vs IEX WFM — How volume is counted differently:
-
CXone WFM (TTI — True to Interval): Volume is counted per interval. An interaction spanning multiple intervals is counted in each interval it touches.
-
IEX WFM (WCE — When Contact Ended): Volume is counted once, in the interval when the interaction ends.
-
-
% Abandoned: The percentage of abandoned calls every 15 minutes. The displayed value is rounded to the nearest whole number. In the report, you can see the exact value.
-
Forecast: The original forecasted value for that time of the day. Data after April 2024 is rounded to the nearest whole number. In the report, you can see the exact value.
If the forecast data in Intraday and the forecast job isn't the same
When you create a forecasting job, the system calculates the forecast data in two stages. First, the data is generated in Forecast Data (step 3 of forecasting), based on the required skills. Second, the system can improve the forecast data by distributing the workload across multiple scheduling units. After defining the Staffing Parameters (step 4), the data is regenerated. This time, the calculation also considers the scheduling units that can handle the interactions. This ensures that the forecast data is as accurate as possible. The forecast data is updated in Staffing (step 5).
When you generate a schedule based on a forecasting job, the forecast data is based on the data in step 5. The final forecast data is also displayed in the Forecast columns in Intraday.
-
Variance (Forecast): The difference between the actual and forecast values. Data after April 2024 is rounded to the nearest whole number. In the report, you can see the exact value.
-
Reforecast: A new forecast for the rest of the day, based on incoming data from the ACD. Shows data only when reforecast is enabled. Data after April 2024 is rounded to the nearest whole number. In the report, you can see the exact value.
-
Variance (Reforecast): The difference between the reforecast and the actual trend coming from the ACD. Shows data only when reforecast is enabled. Data after April 2024 is rounded to the nearest whole number. In the report, you can see the exact value.
The average amount of time it took an agent to answer an interaction after they chose the option to speak to an agent.
When filtering by scheduling unit (not available for users with Cisco UCCX), the data for this metric will be empty. The data intraday receives is per skill, and it can't be split into scheduling units.
-
Actual: The current value for the metric as it comes in from the ACD.
-
Forecast: The original forecasted value for that time of the day.
-
Variance (Forecast): The difference between the actual and forecasted values.
-
Reforecast: A new forecast for the rest of the day, based on incoming data from the ACD. Shows data only when reforecast is enabled.
-
Variance (Reforecast): The difference between the reforecast and the actual trend coming from the ACD. Shows data only when reforecast is enabled.
Columns related to schedule simulation:
-
Projected: The expected value based on the latest schedule re-simulation. Shows data only when reforecast is enabled.
-
Variance (Projected): The difference between the projected value and the actual incoming data from the ACD. Shows data only and when projected data is available.
The percentage of total interactions that agents answered within the defined service level agreement threshold.
For example, you want your agents to answer calls within 20 seconds. If your agents answered 60 out of 100 calls within 20 seconds, the SLA is 60.
The SLA from step 4 is the tentative target, and it gets updated once the forecasting process is complete. That's why the SLA values are different.
Intraday only displays the SLA of the published schedule. You can see the SLA values of future dates by publishing the schedule for that time, and look at the SLA in Intraday.
When filtering by scheduling unit (not available for users with Cisco UCCX), the data for this metric will be empty. The data intraday receives is per skill, and it can't be split into scheduling units.
-
Actual: The current value for the metric as it comes in from the ACD.
-
Forecast: The original forecasted value for the metric as it comes in from the forecasted staffing plan.
Keep in mind that the SLA value here is defined when forecasting, while the SLA value for the actual column comes from the ACD. This means that there might be different values for the same metric.
Let's say that the SLA in ACD is defined as answering 80% of the calls within 60 seconds, and that it's defined as 80% in 120 seconds in the staffing plan. In this case, the actual value and the forecasted value will be different.
When you look at the values in the column, you see two numbers. For example, 80/30. The first value is the SLA, and the second value is how quickly you want your agents to answer the interaction. So the example would mean, answer 80% of the interactions within 30 seconds.
-
Variance (Forecast): The difference between the actual and forecasted values.
-
Reforecast: A new forecast for the rest of the day, based on incoming data from the ACD. Shows data only when reforecast is enabled.
-
Variance (Reforecast): The difference between the reforecast and the actual trend coming from the ACD. Shows data only when reforecast is enabled.
Columns related to schedule simulation:
-
Projected: The expected value based on the latest schedule re-simulation. Shows data only when reforecast is enabled.
-
Variance (Projected): The difference between the projected value and the actual incoming data from the ACD. Shows data only when and when projected data is available.
When checking Intraday, it's important to compare actual values to the projected values. The projected values show what we expect the SLA to be based on the current schedule. By comparing these, you can see how well the SLA is doing compared to what was expected. It's also good to look at future dates to see if the projected values meet your expectations. If they don't, you might need to adjust the schedules.
When using a third-party ACD, the data for Actual might not accurate if agent-level data wasn't received. When the agent-level data isn't received, Intraday displays data according to the skill-level data.
-
Actual: The full-time equivalent
A unit that indicates the workload of an agent. (FTE) of agents that were considered open State that allows an agent to complete work requirements after finishing an interaction.by the ACD, within that time interval. The value is reported as the FTE, rather than individual open agents.See more details
These are the states that agents are considered open by the ACD:
-
Available to answer an interaction.
-
Handling an interaction.
The total number of minutes that the agents were considered open is then divided by 15 (minutes in one interval). This gives the value in the Actual column.
See example
Anna, Kelly, and Martin were scheduled to work between 11:15 and 11:30. During that interval:
-
Anna was considered open for 9 minutes: she was available for calls for 4 minutes, handled one call for 2 minutes, and did after-call work for 3 minutes. She was on break for the remaining 6 minutes.
-
Kelly handled calls for the whole 15 minutes.
-
Martin was available to handle interactions for 6 minutes. After that, he was in a meeting for 9 minutes.
Anna was open for 9 minutes, Kelly for 15 minutes , and Martin for 6 minutes. Together, they were open for a total of 30 minutes.
Divide the number of minutes all three agents were open (30 minutes) by the number of minutes in an interval (15 minutes):
30 minutes agents were open ÷ 15 interval minutes = 2 FTE
Despite having 3 agents scheduled to work during that interval, the Actual value is 2.
-
-
Required: The full-time equivalent (FTE)
A unit that indicates the workload of an agent. number of agents required to handle the interactions (such as calls and chats) within that time interval. The number comes directly from the forecast or staffing plan used to generate the schedule. See examples
Let's say:
-
You expect to handle six calls in a 15-minute interval. The average call takes 10 minutes. This means that during the 15-minute interval, your agents need to be available for 60 minutes (10 minutes per call × 6 calls = 60 minutes).
In this case, the required staffing will be 4.00. Why? Because four agents handling interactions for 15 minutes equals 60.
-
You expect to handle seven calls in a 15-minute interval. The average call takes 10 minutes. This means that during the 15-minute interval, your agents need to be available for 70 minutes.
In this case, the required staffing will be 4.67 (70-minute total handling time ÷ 15-minute interval = 4.67).
-
-
Scheduled: The FTE number of agents that are scheduled to be open to handle interactions within that time interval.
See examples
Let's say you have four agents open during a 15-minute interval:
This means that your agents will be open for a combined 60 minutes during that 15-minute time interval. The staffing you see is 4.00. Why? Because the 60 combined minutes that they're open, divided by the 15 minutes in the interval, equals 4.
During that time, two of those agents will have a ten-minute break. This means that your agents will be open for a combined 40 minutes during that 15-minute time interval. The staffing you see is 2.67. Why? Because the 40 combined minutes that they're open, divided by the 15 minutes in the interval, equals 2.67.
-
Actual Variance: The difference between the actual number of open agents and the required number from the forecast.
-
Scheduled Variance: The difference between the original number of agents scheduled to be open and the required number from the forecast.
More information about:
If you see an empty cell:
-
In the Actual column: This means that no data was received from the ACD. If this continues for more than 15 minutes, contact your administrator.
When the value is 0, there were no calls during that interval.
-
In the Forecast column: This means that you didn't do a forecast for this day, or that it's outside business hours.
-
In the Reforecast column: Reforecast might have empty cells when:
-
There's no forecast or ACD data for at least four hours. WFM needs at least four hours of forecast or ACD data before it can generate the upcoming reforecast intervals.
For example, If your contact center opens at 8:00, the reforecast data will be available from 12:00.
-
The forecast or ACD data is 0 for every interval from the beginning of the day.
Let's say you look at the forecast column and see that the values for all earlier intervals is 0. In this case, there won't be reforecast data.
-
In any other case, an internal error might have occurred. Click Reforecast again. If this does not solve the issue, contact your administrator.
-
The data changes when you change the day you choose to display. If you're looking at:
-
Today: The table displays data from the beginning of the day until your current time.
-
Tomorrow: The table displays data only scheduled and forecast data (if they are available).
-
A future day: The table displays the scheduled forecast data. This includes the forecast data in all columns and the scheduled data in the Staffing column. Let's say you generated a schedule for the next two weeks. You can see forecast and staffing data in Intraday for those two weeks.
-
A day in the past: The table displays all the data from that day.
Reforecast
Reforecast gives you a new, updated forecast for the rest of the day. The reforecast is based on the recent forecast and the recent actual trend from the ACD. This way, the reforecast gets more accurate as the day progresses and you collect ACD data. If you look at the reforecast data early in the day, the values wouldn't be as accurate as what you'd see later. You can enable reforecast from the Settings panel.
The day's reforecast data gets updated every 15 minutes when a new interval starts. The intervals that ended don't get updated.
Let's say you look at the reforecast column at 15:00, 15:15, and 15:30.
At 15:15, the data gets updated for three intervals: from 15:30 until the end of the day at 16:00. Data from before that interval doesn't get updated.
At 15:30, the reforecast data gets updated again. This time, only the 15:45 and 16:00 intervals are affected.
|
Interval |
Reforecast data at 15:00 |
Reforecast data at 15:15 |
Reforecast data at 15:30 |
|---|---|---|---|
| 14:15 | 90 |
90 |
90 |
| 14:30 | 87 |
87 |
87 |
| 14:45 | 100 |
100 |
100 |
| 15:00 |
96 |
96 |
96 |
|
15:15 |
89 |
89 |
89 |
|
15:30 |
92 |
101 |
101 |
|
15:45 |
93 |
102 |
95 |
|
16:00 |
85 |
96 |
89 |
The reforecast data will be 0 when the forecast value for that interval is 0.
So even if the actual data trend increases when your forecast data is 0, the reforecast will still be 0.
Reforecast might have empty cells when:
-
There's no forecast or ACD data for at least four hours. WFM needs at least four hours of forecast or ACD data before it can generate the upcoming reforecast intervals.
For example, If your contact center opens at 8:00, the reforecast data will be available from 12:00.
-
The forecast or ACD data is 0 for every interval from the beginning of the day.
Let's say you look at the forecast column and see that the values for all earlier intervals is 0. In this case, there won't be reforecast data.
When you turn on reforecasting:
-
Each widget displays another graph for reforecasting data.
-
The Reforecast
A new forecast for the rest of the day, based on incoming data from ACD. Reforecast must be enabled. and Variance (Reforecast) Difference between a reforecast and the actual trend from the ACD. Reforecast must be enabled. columns are added to the Intraday table.
You can reforecast only when:
-
There's a forecast to base it on.
The reforecast data gets updated when you filter Intraday by skill. If you're missing reforecast data, there may be no forecast data for that filtered skill.
-
You're looking at the present workday.
Variance Thresholds
In the Intraday table, you can highlight the variance columns to see when the variance is high or low. The cells in the columns are color coded that get darker with the severity of the variance. This way, you can see if there are metrics that require your attention.
The Intraday widgets display the thresholds in a bar under the graph.
The variance for the metrics is the difference between the forecasted and actual values. However, the same variance value can have distinct meanings. Let's compare two cases for the variance of staffing:
-
Case A:
-
Forecast: 100
-
Actual: 130
-
Variance: 30
-
-
Case B:
-
Forecast: 1000
-
Actual: 1030
-
Variance: 30
-
We can see that the variance for both cases is 30, but in the second case (+3%) it's not as severe as the first (+30%). Based on the variance thresholds, both cases will be color coded differently. It doesn't matter that the variance is the same value.
To enable variance thresholds:
-
Click the app selector
 and select WFM.
 -
Click Intraday.
-
Click Options
 and select Settings.
 -
In Apply to, select the metrics you want to color code.
-
The scale for each metric has levels of severity that can be adjusted. Slide the control to define the threshold.
The color of the area will be the color in Intraday.
See example
Let's say you define the SLA metric:

-
Dark red: The cells are this color when the variance is -20% or lower.
-
Light red: The cells are this color when the variance is between -20% and -5%.
-
No color: Between -5% and 5%.
-
Light blue: Between 5% and 20%.
-
Dark blue: 20% or higher.
-
-
Click Save.
Export Intraday Data
You can export the data from the Intraday Manager table to a CSV file.
The exported CSV displays the values for time in seconds.
Keep in mind, the exported file may be missing data if you select more than 50 skills. To avoid missing data, try lowering the date range or exporting twice with a shorter date range for each export. Let's say you want to export 50 skills over 14 days. Try exporting twice, each export for 7 days.
To export Intraday data:
-
In the top right of the page, click Options
> Export. -
Define the date range for your export.
-
Select the Scheduling Units, Skills, and Metrics you want to export data for.
The Export Intraday Data window opens with the filters set to whatever you defined in the Intraday Manager, but you can change them.
-
Click Export.
The intraday data is exported to a CSV file and downloaded to your computer.
Daily AHT in the Intraday Export
If your tenant uses CXone ACD with TTI, the exported CSV file includes a Daily AHT column:
• The Daily AHT column appears as the last column in the AHT section of the CSV file. It is displayed only if you select any AHT metrics. <Screenshot>
• Daily AHT is a daily value, so all intervals for the same day show the same Daily AHT.
• If Daily AHT does not apply to your tenant (for example, third-party ACD or side-by-side / WCE), the Daily AHT column does not appear in the export.
• If an error occurs while calculating Daily AHT, the rest of the export is not impacted. Existing columns are exported as usual, and the Daily AHT value appears as a blank cell.
Copilot Q&A
This feature is only available with the WFM Premium license.
You can ask WFM questions directly from the Intraday Manager without switching to another page. The Copilot Q&A panel is embedded in the Intraday header and uses the same AI-powered assistant available in CXone Actions. This helps you review recent adherence and coverage patterns, evaluate post-shift outcomes, and prepare for upcoming days, all within the same intraday view.
To open the Copilot Q&A panel:
-
Click the app selector
and select WFM. -
Go to Intraday Manager.
-
In the Intraday header, click the Copilot icon to open the panel.
-
Enter a WFM question in the text box and press Enter.
-
To close the panel, click the Copilot icon again.
The panel is closed by default each time you open Intraday Manager.
The Copilot panel supports the same curated set of WFM questions available in CXone Actions, including adherence and agent behavior, service performance, staffing coverage, and availability conflicts. For the full list of supported metrics and sample questions, see Conversational Panel Metrics.
Keep in mind:
-
Answers are based on reporting data, not real-time intraday data, with a latency of approximately three hours. The panel is best suited for performance evaluation, post-shift review, and short-term planning.
-
WFM Managers can open the panel, submit queries, and view responses. Users with view-only Intraday permissions can see the panel and responses but cannot submit queries.
-
Responses support lists and tables, with a limit of 30 queries and responses per session.
-
Your conversation resets when you navigate away from Intraday Manager.
-
Not all functionality in the full CXone Actions conversational panel is supported in the Intraday Copilot panel.
-
Permissions are enforced based on your role.
Copilot Q&A for WFM is also available in CXone Actions.
Troubleshoot Intraday
The forecast data is based on the forecast you used to generate your schedule. Intraday gets updated with the new forecast data once you publish the schedule.
Before you publish the schedule, remember which forecast you selected.
If the forecasting data in Intraday doesn't match the data you expect to see:
-
Try removing the filters. When filtering Intraday data by skills, the displayed forecast data is also filtered.
-
Check the forecast you selected to generate the schedule. It might different from the forecast you expect.
-
Check if you published the schedule. Intraday gets updated with the new forecast data once you publish.
When you filter Intraday by Scheduling Unit, some Volume metrics cannot be displayed because they are measured at the Skill level, not at the Agent or scheduling‑unit level. These metrics, including the Actual and Abandoned columns in Volume, cannot be split by scheduling unit. As a result, the cells in these columns are empty when you apply a scheduling unit filter.
When this occurs, Intraday displays the following message:
Intraday is filtered by the scheduling unit, and data is displayed by the agent. Some data measured by skill won't be displayed.
To review how Volume metrics behave when you filter by scheduling unit, see the Intraday Table section.
Intraday gets updated with the new forecast data once you publish a schedule. The forecast data is based on the forecast you used to generate your schedule.
The Actual column displays the full-time equivalent![]() A unit that indicates the workload of an agent. (FTE) of agents that were considered open
A unit that indicates the workload of an agent. (FTE) of agents that were considered open ![]() State that allows an agent to complete work requirements after finishing an interaction.by the ACD, within that time interval. The value is reported as the FTE, rather than individual open agents.
State that allows an agent to complete work requirements after finishing an interaction.by the ACD, within that time interval. The value is reported as the FTE, rather than individual open agents.
These are the states that agents are considered open by the ACD:
-
Available to answer an interaction.
-
Handling an interaction.
The total number of minutes that the agents were considered open is then divided by 15 (minutes in one interval). This gives the value in the Actual column.
Let's say Anna, Kelly, and Martin were scheduled to work between 11:15 and 11:30. During that interval:
-
Anna was considered open for 9 minutes: she was available for calls for 4 minutes, handled one call for 2 minutes, and did after-call work for 3 minutes. She was on break for the remaining 6 minutes.
-
Kelly handled calls for the whole 15 minutes.
-
Martin was available to handle interactions for 6 minutes. After that, he was in a meeting for 9 minutes.
Anna was open for 9 minutes, Kelly for 15 minutes , and Martin for 6 minutes. Together, they were open for a total of 30 minutes.
Divide the number of minutes all three agents were open (30 minutes) by the number of minutes in an interval (15 minutes):
30 minutes agents were open ÷ 15 interval minutes = 2 FTE
Despite having 3 agents scheduled to work during that interval, the Actual value is 2.
Check if the ACD skill is mapped to the WEM skill. If someone changed the mapping, the data in Intraday will also change.
This solution can help when you see data that’s not what you’re expecting, or if there’s an unexpected drop in the data.
If you see an empty cell:
-
In the Actual column: This means that no data was received from the ACD. If this continues for more than 15 minutes, contact your administrator.
When the value is 0, there were no calls during that interval.
-
In the Forecast column: This means that you didn't do a forecast for this day, or that it's outside business hours.
-
In the Reforecast column: Reforecast might have empty cells when:
-
There's no forecast or ACD data for at least four hours. WFM needs at least four hours of forecast or ACD data before it can generate the upcoming reforecast intervals.
For example, If your contact center opens at 8:00, the reforecast data will be available from 12:00.
-
The forecast or ACD data is 0 for every interval from the beginning of the day.
Let's say you look at the forecast column and see that the values for all earlier intervals is 0. In this case, there won't be reforecast data.
-
In any other case, an internal error might have occurred. Click Reforecast again. If this does not solve the issue, contact your administrator.
-
When using a third-party ACD, the data for Actual in the Staffing metric might not accurate if agent-level data wasn't received. When the agent-level data isn't received, Intraday displays data according to the skill-level data.
During the forecast process, (step 3) involves generating a raw forecast, focusing solely on volume and Average Handling Time (AHT) per skill, without considering the agents. From (step 3) to (step 5), a simulation process occurs, distributing agent requirements to each scheduling unit that handles the forecasted skills. These requirements are then translated back into volume per skill per scheduling unit.
In (step 5), as shown in the screenshot, we can observe the volume and AHT for the interval from 8:00 AM to 8:15 AM, indicating the expected number of contacts to be handled per scheduling unit per skill as a result of the simulation.
The volume flowing from step 3 of the forecast job to step 5, and subsequently to the Intraday page, will match the total volume at step 5 of the forecast job and the numbers on the Intraday page.
If the Contact Center has adequately staffed agents for a given skill, the ASA would generally be zero. This indicates that incoming contacts are being answered immediately, without any wait time.
Even if your Contact Center is overstaffed, ASA (Average Speed of Answer) may still be greater than zero. This can happen when agents are logged in but not ready to take calls—for example, they may be on a break, in after-call work (ACW), or in a non-ready state. If actual adherence is low, ASA can rise despite having enough scheduled agents.
Also, check your configuration settings. ASA is reported at the WEM skill level, so make sure the WEM skill is correctly mapped to the relevant ACD skills.
This is typically caused by the difference in how CXone WFM and IEX WFM count volume:
-
CXone WFM (TTI) counts an interaction in every interval it spans. If a call starts in one interval and ends in the next, it is counted in both.
-
IEX WFM (WCE) counts an interaction only once, in the interval when it ends.
A phone call starts at 10:58 and ends at 11:03, spanning two 15-minute intervals.
-
CXone WFM (TTI): counted in both the 10:45–11:00 and 11:00–11:15 intervals
-
IEX WFM (WCE): counted only in the 11:00–11:15 interval
This means CXone WFM may show a higher actual volume than IEX WFM or your ACD report for the same time period. This is expected behavior, not a data error.
To verify, check the Actual Volume formula: Handled + Abandoned + Active = Actual Volume. If the "Active" component is included (TTI users), it will add interactions still in progress from a previous interval, increasing the count.