

The Process Analytics Report page displays the detailed analysis of the report. You can select a process![]() A process is a set of routines which belong to a business task. or routine
A process is a set of routines which belong to a business task. or routine![]() Routines summarize the sequence of actions that occurred. to view more details about the respective process or routine. This page enables you to analyze the user performance by helping you determine if the user work is considered efficient.
Routines summarize the sequence of actions that occurred. to view more details about the respective process or routine. This page enables you to analyze the user performance by helping you determine if the user work is considered efficient.
The minimum supported resolution is 1024x768.
Desktop Discovery collects the report data from Automation Finder. Each report is a group of routines discovered within the specified time frame and performed by the selected teams. For more information on reports, refer to the Report Management section in the NEVA Discover Solution Guide in APA Help Center.

The numbers in the report summary bar represent the entire report.
-
Users: The total number of different users in all the routines found in the report.
-
Teams: The total number of different teams that executed the routines in the report.
-
Total Actions: The total number of actions analyzed in creating this report.
-
Total Recorded Time: The total time recorded from all agents.
-
Date: The date range of the report.
-
Actions in Routines: The percentage of the actions that belong to any of the routines in the report. For more information, refer to Actions in Routines.
-
Copy Link: Option to share the report data through a link.
Click
 icon, and then select Copy Link. A message "Link has been copied to clipboard" is displayed. You can paste the link to the browser and get directly to the relevant report.
You can select a process or routine from the Process or Routine drop-down. Search for the process or routine in the Search for field and click the value. This shows the detailed analysis of the selected process or routine. The following information is displayed:
-
Total Time: The total time for all occurrences of the routine.
-
Score: An indication on a scale of 0 to 100 of the automation potentials of the routine.
-
Occurrences: Number of instances.
-
Type: The following options are available:
-
Data Entry: A routine that primarily consists of text input actions.
-
Copy paste: A routine that primarily consists of copy-paste actions.
-
Template: A routine that consists of different applications as data sources and contains predefined structured texts combined with dynamic text.
-
Other: A routine that mainly consists of clicks and selection actions and does not have any dominant text actions.
-
Based on the process or routine selected, all the widgets display the data related to the selected value.
Actions in Routines
Expand the Actions in Routines to display the percentage of actions that belong to any of the routines in the report. This indicates how much of the total employees' work is represented. It includes two sections, one for the applications and one for the users.
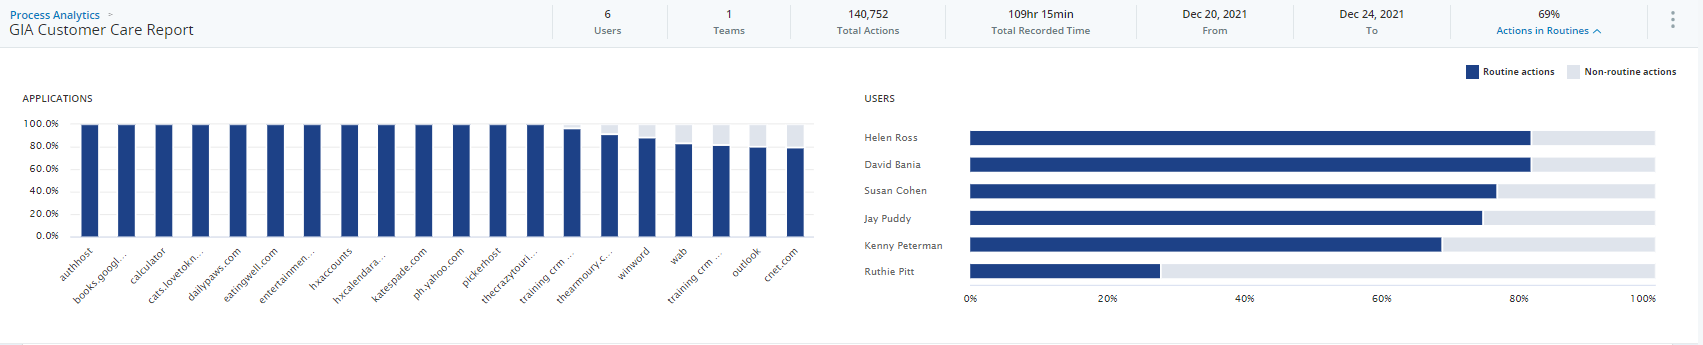
Two types of actions are displayed:
-
Routine actions: These are the actions that belong to any of the routines in the report.
-
Non-routine actions: These actions do not belong to any of the routines and are not represented in any widget.
Applications
It displays the percentage of actions that belong to any of the routines in the report per application. The top 20 applications with the highest usage are shown. You can hover over the application-specific bar to view the value in percentage.
Users
For each user, it displays the percentage of actions that belong to the routines in the report. The list of users shows the individual percentage value of the actions as per their usage across all the applications. You can hover over the user-specific bar to view the value in percentage.
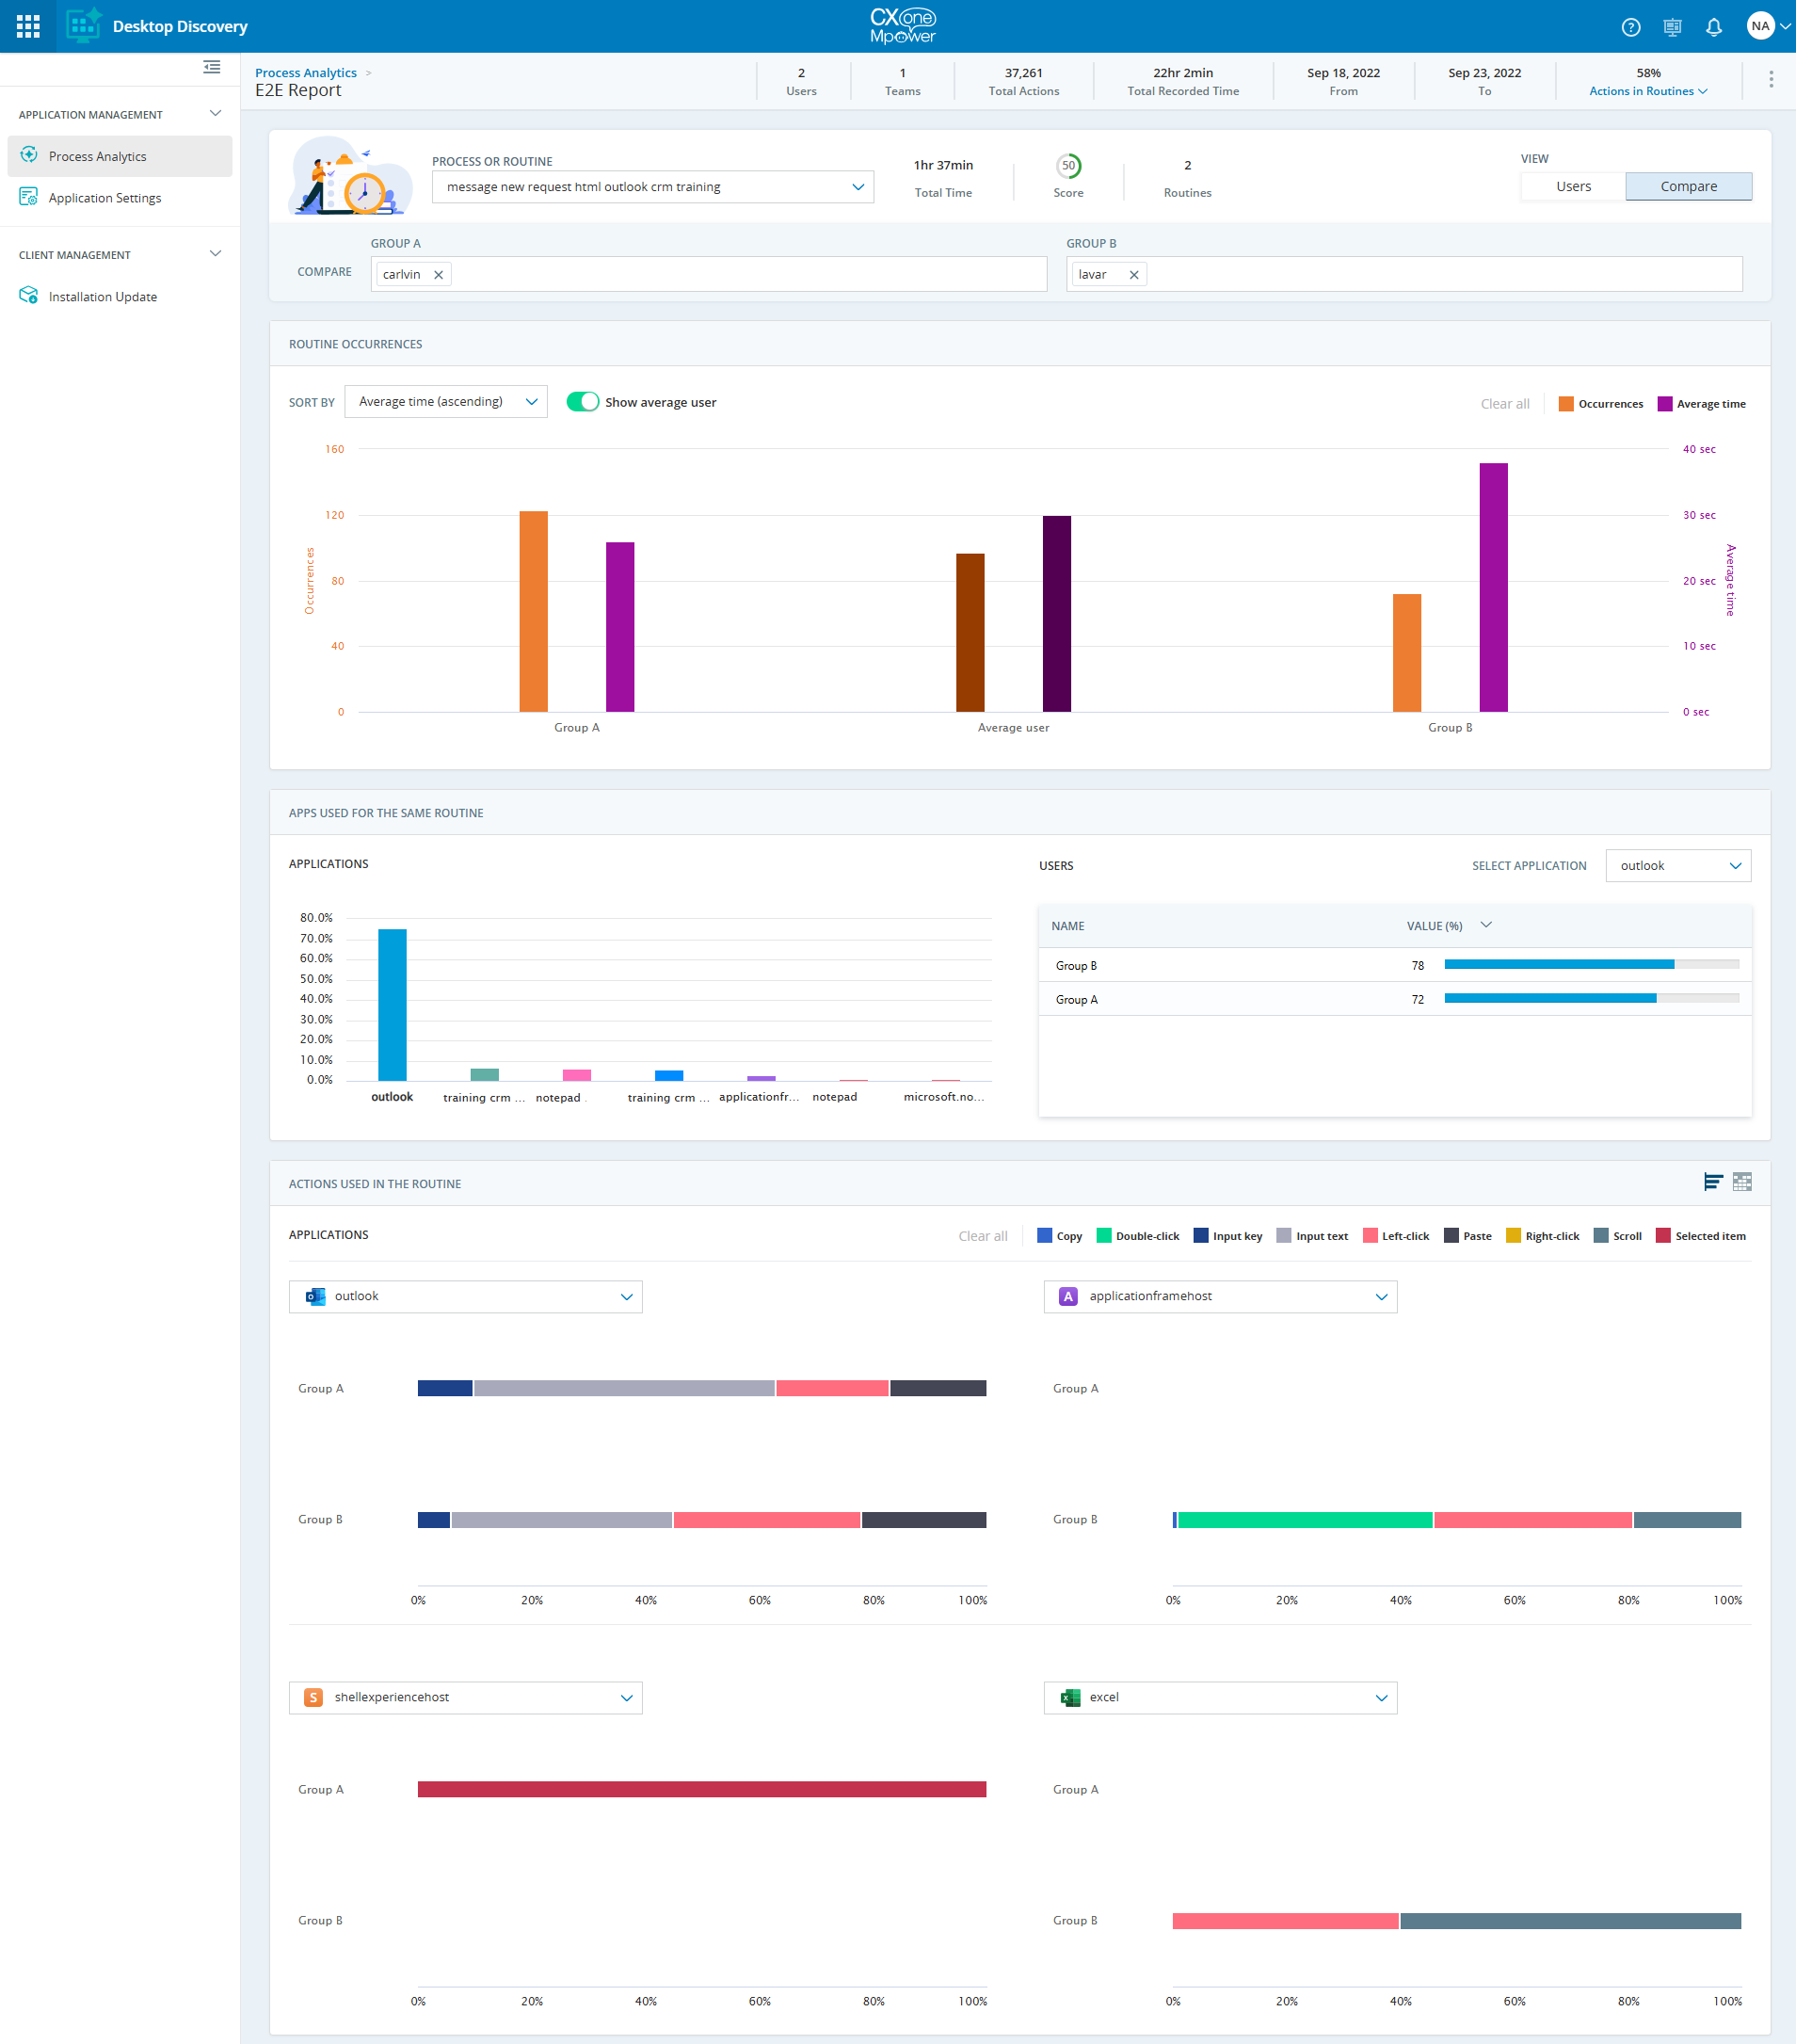
Users or Compare View
There are two options available to view the data. Based on this selection, the subsequent widgets show the data.
-
Users: By default, this option is selected. This shows the individual user’s data in the widgets.
-
Compare: This option enables you to compare two groups containing a different set of users.
Based on the actions performed by different users, you can compare their performance by adding them to a particular group. You can compare how Group A and Group B execute the same tasks to gain insight into potential efficiency gaps and improvement points. A user can either be selected in Group A or Group B at the same time.
To compare the group users:
-
Click Compare view at the top-right corner of the Process Analytics Report page.
-
Select the users from Group A drop-down.
-
Select the users from Group B drop-down.
All the widgets show the data for Group A and Group B.
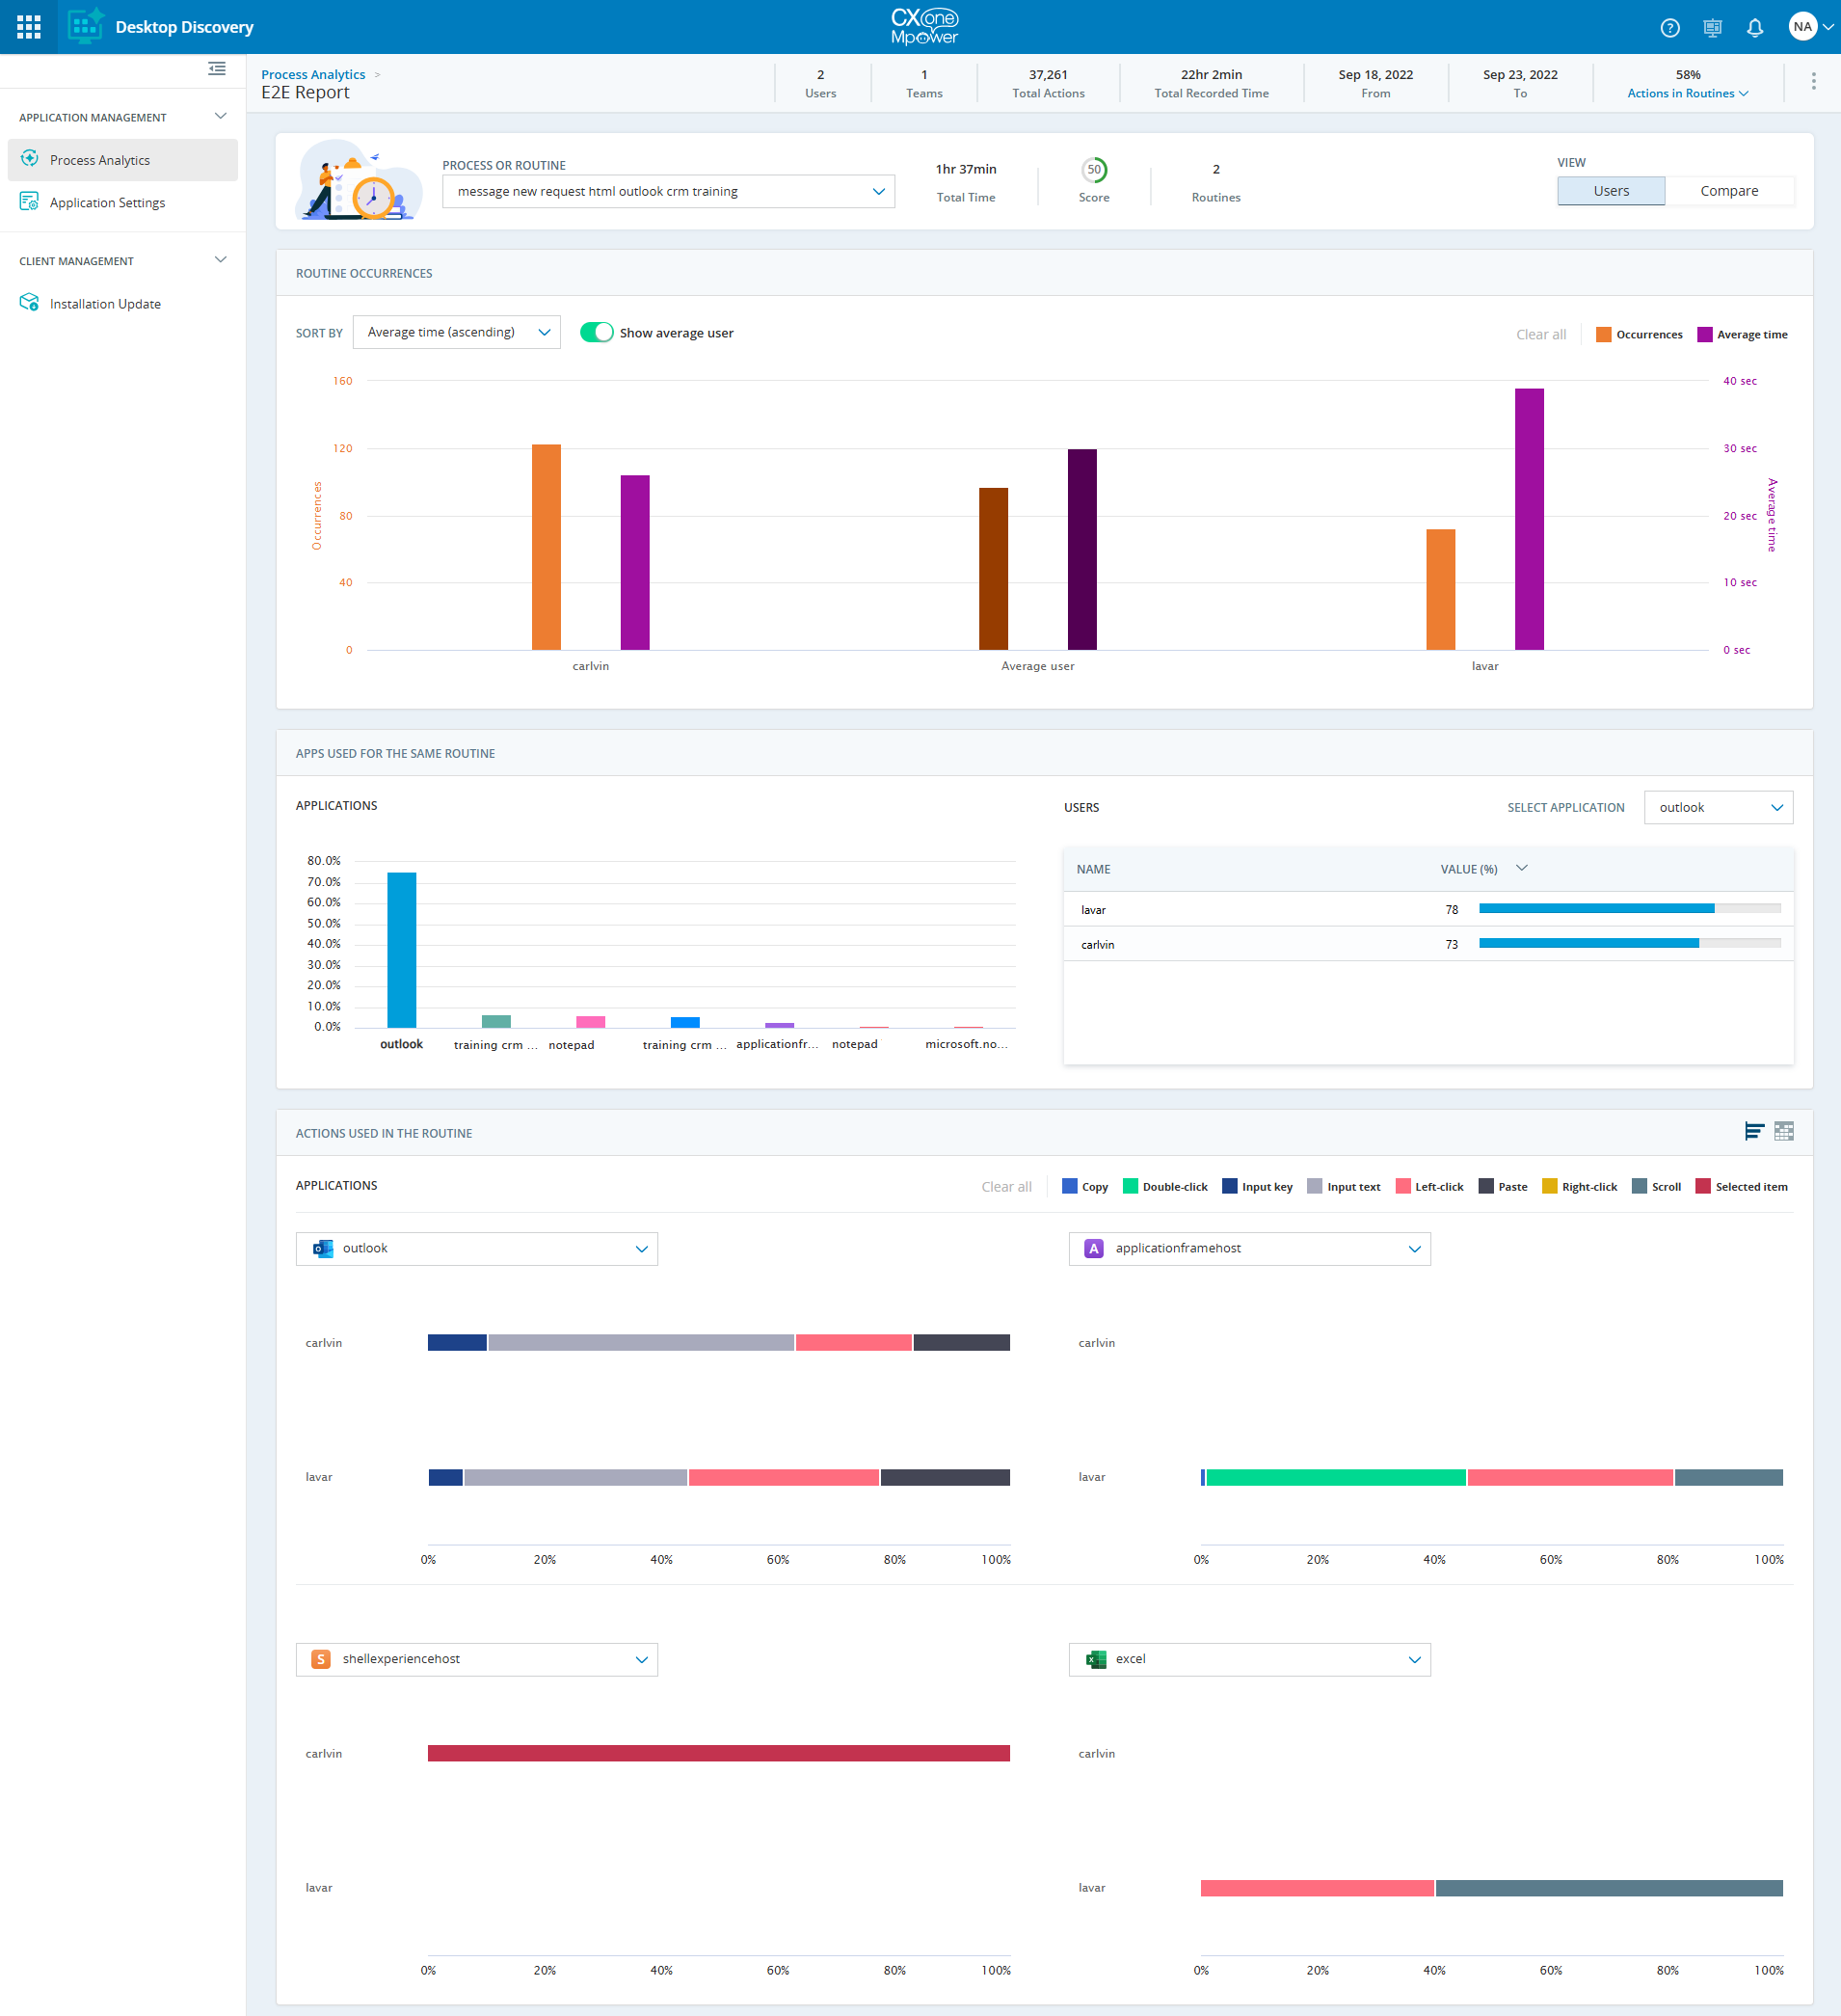
Routine Occurrences
This widget displays the total number of times the routine was executed, and the average time spent on it by the individual users. Each user in the routine has some value in terms of the number of occurrences and the average time spent. The graph provides a visual comparison of all the users available in the selected routine. You can view the actual number of occurrences and the average time for each user by hovering the mouse over the respective bar graph.
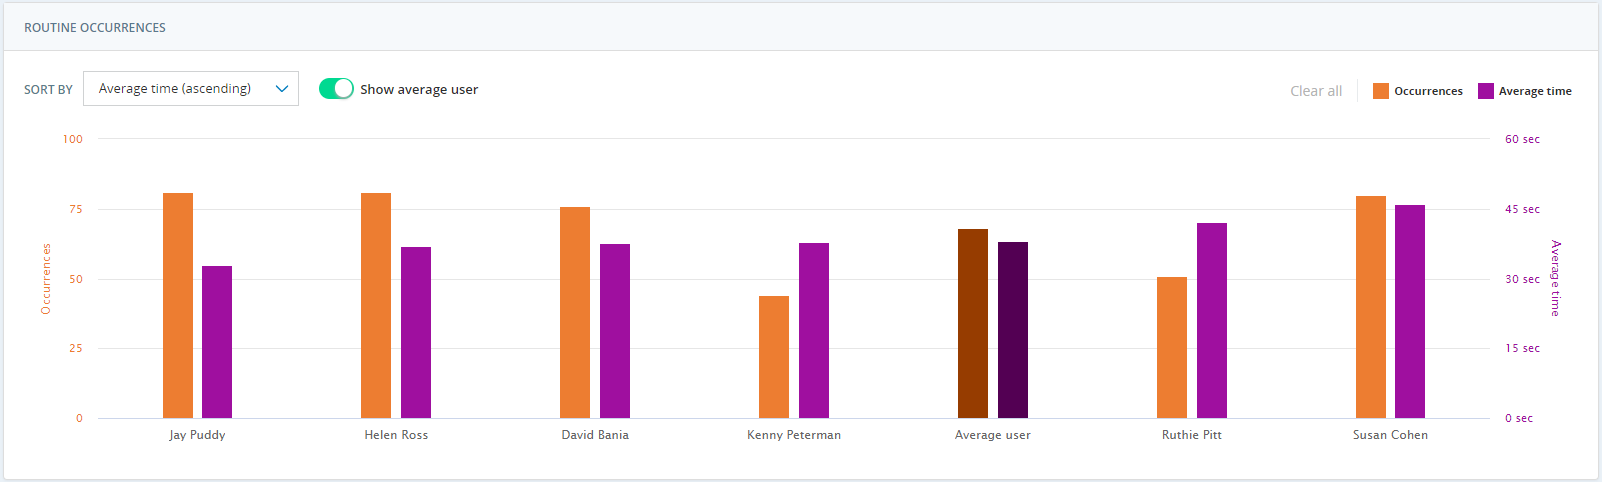
Occurrences and Average time Graphs
You can view the data for Average time, Occurrences, or both. By default, both bars are displayed. Click the Occurrences or Average time options in the top-right corner of the widget to view the respective data for each user.
Show average user
Enable or disable the Show average user toggle to view or hide the average user data in the graph. By default, this value is enabled. When enabled, the widget shows the graph for an average user which represents the average number of instances and average time. This is used as a comparison point.
Sort By
Sort the data available in the widget by selecting a value in the Sort By drop-down. These options are available:
-
Average time (ascending): Arrange the users by average time in ascending order. This is the default option.
-
Average time (descending): Arrange the users by average time in descending order.
-
Occurrences (ascending): Arrange the users by the number of occurrences in ascending order.
-
Occurrences (descending): Arrange the users by the number of occurrences in descending order.
Apps Used for the Same Routine
This widget displays the data for different applications and their usage by different users. It includes two sections, one for the applications and one for the users.
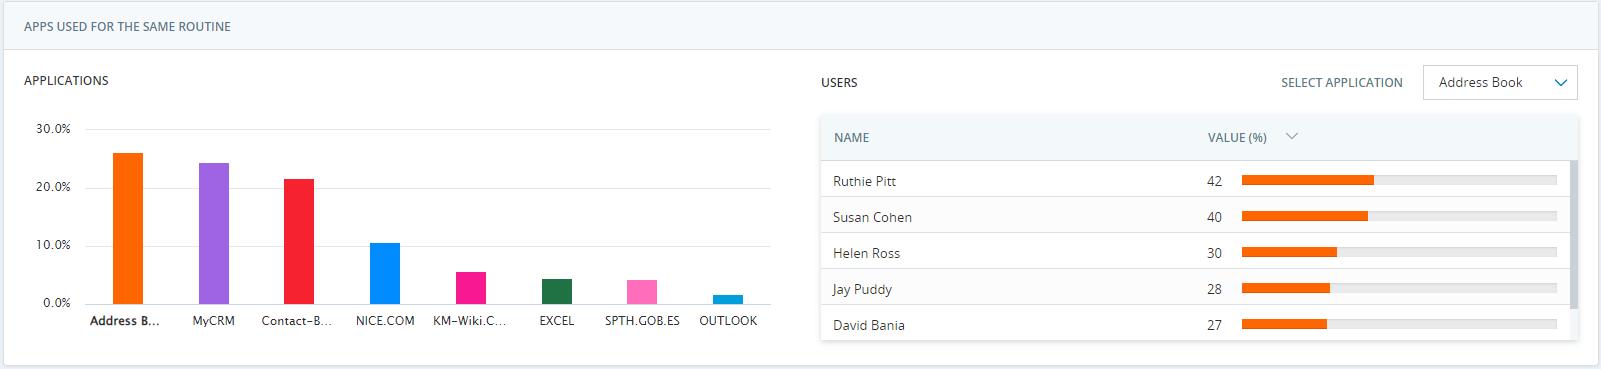
Application
This section displays the percentage share of different applications used by all the users in the routine![]() Routines summarize the sequence of actions that occurred.. You can hover over the application-specific bar to view the value in percentage. The application selected in the Application graph automatically gets selected in the User graph. The selected application name is displayed in bold.
Routines summarize the sequence of actions that occurred.. You can hover over the application-specific bar to view the value in percentage. The application selected in the Application graph automatically gets selected in the User graph. The selected application name is displayed in bold.
User
This section displays the percentage share of a single application used by different users. Select an application from the Select Application drop-down. The list of users shows the percentage value of the selected application as per their usage. Use the scroller to view all the users. You can sort the values by clicking the Name and Value (%) columns.
Actions Used in the Routine
This widget displays how users interact with the applications which are part of the routine![]() Routines summarize the sequence of actions that occurred. or process
Routines summarize the sequence of actions that occurred. or process![]() A process is a set of routines which belong to a business task.. The data is shown in two formats: Chart and Grid. By default, the chart view is selected. You can switch between the two views by clicking the respective icons at the top-right corner of the widget.
A process is a set of routines which belong to a business task.. The data is shown in two formats: Chart and Grid. By default, the chart view is selected. You can switch between the two views by clicking the respective icons at the top-right corner of the widget.
Chart view
The chart view displays how users interact with each of the top four applications which are part of the routine or process. The widget displays up to four charts. Each chart represents the share of the different actions used to interact with an application and its usage pattern. You can view the percentage share of various actions performed by all the users in various applications and easily compare them. Hover over the action-specific bar to view the value in percentage per action per application. Clicking any action in a chart displays the drill-down data in a grid format. In this case, data is shown for the particular selection only. To view the whole data in a grid format, click  icon. For more information on grid view, see Grid view.
These are some of the key features of chart view:
-
The user using the routine the most is listed first.
-
Applications in the routine with the highest usage are listed first followed by other apps in descending order (left to right and top to bottom).
-
Hovering over an action highlights the action in the same chart for all the users.
-
You can change the application from the drop-downs available in the chart.
-
By default, all the actions are displayed. You can click a specific action or multiple actions in the top-right corner of the widget to view the respective data. Click Clear All to clear the selected actions and display all the actions.

The widget displays these actions that users can perform while using an application as part of a routine:
-
Copy
-
Double-click
-
Input key
-
Input text
-
Left-click
-
Paste
-
Right-click
-
Scroll
-
Selected item
The grid view displays a more detailed drill-down view of the selected action in a chart or the whole widget. Unlike the chart view, the grid view shows data for all the applications. You can click  icon to go back to the chart view. The grid view displays the following information:
-
User: The name of the user.
-
Time: The time at which the action was performed.
-
Action Name: The name of the action.
-
Action Component: The UI component on which the action was performed.
-
Window Title: The title of the window in which the action was performed.
-
Application: The name of the application.
-
Duration: The duration that took the user to perform the action.

You can do the following in the grid view:
-
Search for actions: The search field is not case-sensitive. Data in all columns are searched. If you search for more than one word, either one will be found. To clear the search results, click
 icon.
icon.
-
Apply filter on User, Action Name, and Application columns to select the desired option(s).
-
Sort all the columns.
-
Navigate to various pages to view the different actions.