

Reporting ![]() in NiCE CXone Agent Workspace (Agent) displays reports with data that help you evaluate your performance. There are two reports: the Productivity report and the Performance report. To access these reports, click Reporting
in NiCE CXone Agent Workspace (Agent) displays reports with data that help you evaluate your performance. There are two reports: the Productivity report and the Performance report. To access these reports, click Reporting ![]() in the
in the
The data in reports updates when you:
-
Open Reporting
 .
. -
Switch between the Productivity and Performance reports.
-
Select a new date range: Today, Yesterday, Last 7 Days, or Custom.
Reports may take some time to display the latest data.
Productivity Report
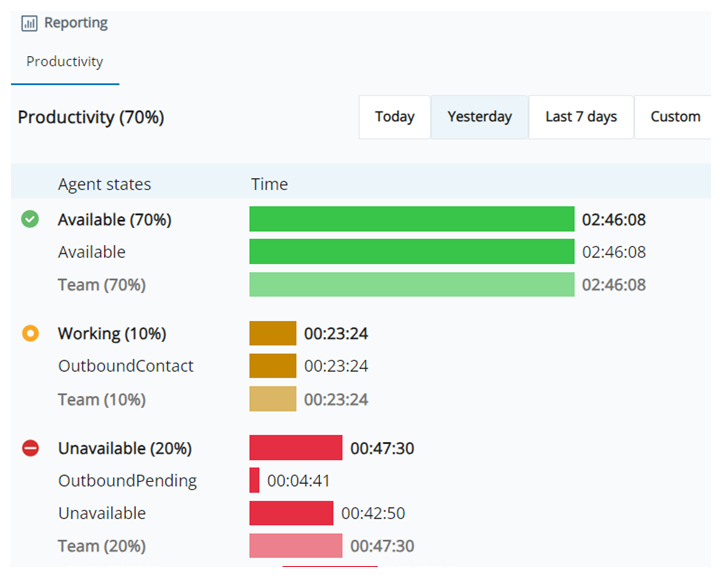
The Productivity report displays how much time you spent in each of these states![]() The availability status of an agent. and sub-states:
The availability status of an agent. and sub-states:
| State | Sub-States |
|---|---|
|
Available |
There are no sub-states for Available. |
| Working |
Possible Working sub-states include:
Calls made directly to other agents in the contact center are not included in these working sub-states. |
|
Unavailable |
Unavailable sub-states are configured by your administrator. They are unique to your organization. |
The Productivity report displays these values:
-
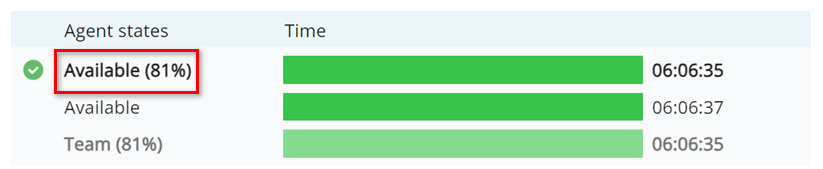
The percentage of time you spent in each state. These values are in parentheses next to each state's name.
-
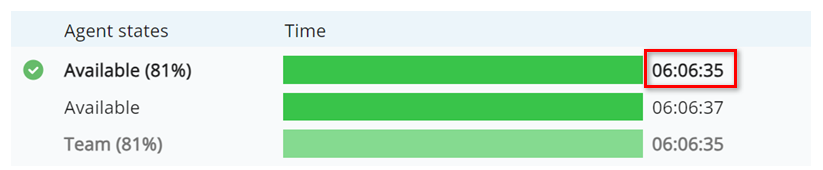
The amount of time you spent in each state, in this format: HH:MM:SS. These values are next to the bars for each state.
-
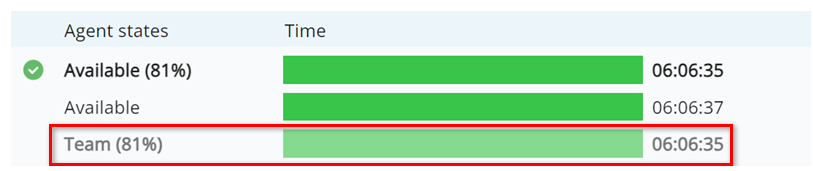
The percentage and amount of time your team spent in each state. These values are indicated by the gray text and lighter-colored bars.
Performance Report
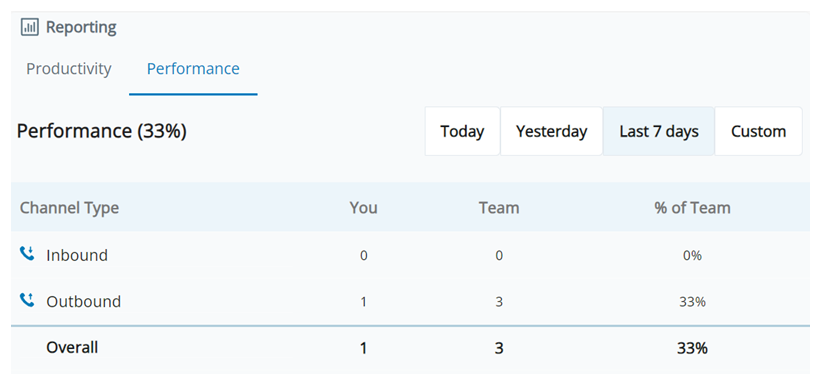
The Performance report displays:
- The number of inbound and outbound interactions that you handled.
- The number of inbound and outbound interactions that your team handled.
- The percentage of your team's inbound and outbound interactions that you handled.